 LOGIN
LOGIN REGISTER
.png)


Research Article
Characterization and Evaluation of Rice (Oryza sativa L.) Genotypes in Randomized Complete Block Design
Ujjawal Kumar Singh Kushwaha* and Indra Deo
Department of Genetics and Plant Breeding, College of Agriculture, G. B. Pant University of Agriculture and Technology, Pantnagar, India
*Corresponding author: Ujjawal Kumar Singh Kushwaha, Department of Genetics and Plant Breeding, College of Agriculture, G. B. Pant University of Agriculture and Technology, Pantnagar, India, E-mail: kushujjwal@gmail.com
Citation: Kushwaha UKS and Deo I (2019) Characterization and Evaluation of Rice (Oryza sativa L.) Genotypes in Randomized Complete Block Design. J Environ Sci Allied Res 2019: 39-49. doi: https://doi.org/10.29199/2637-7063/ESAR-201020
Received Date: 13 December, 2018; Accepted Date: 25 February, 2019; Published Date: 01 April, 2019
Abstract
To characterize, compare and evaluate rice yields and its attributing traits, two-season experimental trials were conducted in a randomized complete block design with a standard check Pant Dhan-4 in 2016 and 2017, respectively. The tested genotypes were statistically significant (p<0.05) based on traits such as days to flowering, days to maturity, number of effective tillers, panicle length, fertile and sterile grain number per plant and yield. The average grain yield of rice genotypes transplanted in 2016 (10153.85 kg/ha) was higher than 2017 (5598.38 kg/ha). The minimum night temperature during grain filling period in Kharif 2016 was lower than 2017 by as much as 3.410C and we conclude that the elevated night temperature was detrimental to rice productivity. The yield increment in 2016 might be due to favourable weather conditions and ideal night temperature during the crop growth and development phase. The findings confirm that climate variables have significant effects on yields but these effects vary among rice genotypes. The results also reveal that the Pantnagar crop is severely affected by extreme temperature. Only four genotypes were found completely resistant to bacterial leaf blight during both years of the experiment. The resistant genotypes showing promising yields were selected for further evaluation.
Keywords: Bacterial Leaf Blight; Climate Change; Night Temperature; Rice Yield; Characterization
Introduction
Rice is the most important crop commodity and staple food of about half of the world populations [1]. It is also the staple food of more than 65% of the Indian population and accounts for 46% of cereal production in the country. India is the 2nd largest rice producer in terms of acreage and is the biggest exporter in the world. The area, production and productivity of rice in India was 4, 33, 88,000 ha; 10, 43, 20,000 tonnes and 2,404 kg/ha in 2016-17, respectively [2]. Although rice is a mainstay food of the country, its productivity (2.4 metric ton/ha) is limited. Major constraints that affect the production and productivity are abiotic-biotic stresses, methods of agronomic management and seed quality [3]. Abiotic stress like weather factors (temperature, rainfall, humidity, solar radiation and wind velocity) exerts significant effects on productivity and disease severity [4]. The fast-growing Indian population's food demands can only be addressed with an increase in crop productivity. Therefore, the best way to boost crop productivity is to grow climate-resilient, high-yielding, and disease-resistant varieties with a full agronomic package of practices.
Indian agriculture is severely affected by abiotic stresses like drought, salinity, high temperatures, and soil acidity. Several reports show that the earth surface in the Indian peninsula is warming in an accelerated rate with a minimum (night time) temperature rising 0.025 0C per year during 1980-1990 and 0.056 0C per year during 1990-2000 [5,6]. The surface solar radiation was shown to fall by about 5 % during 1980-2004 [5]. Rao et al. [7] reported a minimum temperature rising at the rate 0.24 0C per decade over India, and warming during Ravi (October-March) was faster than Kharif (June-October) by 0.09 0C per decade. A slight but definite warming trend in the mean annual Indian temperature has already been reported [8].
Temperature and radiation have significant impacts during both the vegetative and ripening phases of the rice plant [9]. It has been observed that higher minimum temperatures reduce yield, whereas higher maximum temperatures raise it, and radiation impact varies by growth phase [10,11]. Mohammed and Tarpley [12] reported that high night temperature is associated with reduced yield resulted from spikelet sterility and reduced grain length, width and weight. Auffhammer et al. [5] also reported that rice yield tends to be reduced by higher minimum temperature and lower solar radiation, especially during the latter part of growing season. Different simulated models have been also developed to test the effects of temperature on rice yields. The ORYZA1 and INFOCROP models predicted an average yield decline of 7.20 % and 6.66 %, respectively for every 1 °C increase in temperature at 380 ppm of CO2 [13]. A field-based experiment also revealed a rice yield decline by 10% for each 1°C increase in minimum temperature in the dry season [14].
In addition to abiotic stress, biotic factors are also responsible for yield reduction. An economically important biotic factor destructive to rice is Bacterial leaf blight (BLB; Xanthomonas oryzaepv. Oryzae), the most serious bacterial disease in rice-producing countries like India [15,16]. It limits rice yield especially in irrigated lowland and rainfed conditions where predisposition factors favour disease development. This disease is widely prevalent among various rice varieties worldwide [17]. This disease could cause 15-25% of the yield loss each year, losses as high as 30-40% may also occur [18]. Suresh et al. [19] found that maximum temperature has a significant positive and rainfall has a negative correlation with BLB development. They also reported an increase in disease severity between the 3rd and 4th week of October. The most appropriate way of controlling BLB is to develop resistant varieties through successful breeding programs [20]. Scientists have also identified 38 genes that confer resistance to BLB and designated them in a series from Xa1 to Xa38 [21]. These resistance genes are not universally effective across all locations at all times due to the geographical structuring of the pathogen and its races. Therefore, continuous efforts are made to transfer genes from wildrelatives (http://www.apsnet.org/publications/PlantDisease/BackIssues/Documents/1993Articles/PlantDisease77n01_5.PDF). Despite the economic importance of BLB, complete resistance has not been reported [22].
In this study, two-season field experiment was conducted to observe the effects of temperature on yield and its attributing traits. Rice genotypes were also characterized and evaluated. We correlated the epidemics of disease with weather conditions. Statistical analyses of the resulting BLB epidemics, rice yield, and the rice yield components were used to develop the best explanation for the disease severity and crop loss relationship.
Material and Methods
Experimental trial set up
An experimental trial was set up in a randomized complete block design in two replications with a standard check Pant Dhan-4 in open field condition at Norman E. Borlaug Crop Research Centre, G. B. Pant University of Agriculture and Technology, Pantnagar India during Kharif season 2016 and 2017, respectively. The trial was geographically located at a latitude 29050’N, longitude 790 30’ E, and altitude 243.84 meters from mean sea level. The test entries were obtained from the International Rice Research Institute (IRRI) as an IRON (International Rice Observation Nursery) trial in 2016. Altogether 40 genotypes were used in the study where Pant Dhan-4 was used as a standard check, resistance to BLB (Table 1).
Table 1: IRON rice genotypes and their Bacterial leaf blight scoring done in 2016 and 2017. |
Seed sowing and crop management
Seeds were sown in well-prepared land at the last week of May, and 25 days old seedlings were transplanted at 15 X 15 cm spacing of row to row and plant to plant in a fine prepared puddled field each year. Each plot consisted of an area of 2.5-meter square. The amount of fertilizers was calculated based on the recommended doses of NPK@120:60:40. Half nitrogen and the full dose of phosphorus and potash fertilizers were applied as basal before transplanting of rice. The remaining half of nitrogen was applied into two equal splits first at tillering, and second at the flowering stage. Necessary intercultural operations like weeding and irrigation were carried out routinely.
Data recording and observation
Rice traits like days to flowering, days to maturity, effective tillers per plant, panicle length, fertile grain per panicle, sterile grain per panicle and yield per plot were taken according to the Standard Evaluation System for Rice (SES) IRRI 2013 protocol (http://www.clrri.org/ver2/uploads/SES_5th_edition.pdf). The parameter of days to flowering was calculated as the time from date of sowing until 80% of the rice genotypes per plot flowered, days to maturity was calculated as the time from date of sowing until 80% of the grains per plot ripened, effective tiller per plant was obtained by counting the mean of total tillers of five plants per plot at the crop maturity stage, panicle length was measured as the mean length of selected five panicles per plot, fertile grain per panicle was calculated as the mean number of fertile grains of five panicles, sterile grain per panicle was calculated as the mean number of sterile grains of five panicles, and yield was calculated as the total weight of grains per plot expressed in Kg/ha. The fresh grain yield was weighed after five days of sun drying in the field, including moisture percentage.
Artificial inoculation of Bacterial leaf blight (BLB)
Artificial inoculation of BLB was done by the clipping method. Bacterial leaf blight (Xanthomonas oryzae pv. Oryzae) infected leaves were taken and cut into small pieces with scissors. The leaves were dipped in a small bucket half filled with water. It was left undisturbed for 24 hours. The prepared inoculums were taken to the field and a sickle was chopped in bacterial suspension, used to cut about 1-2 cm of leaf tips per plant per plot. The inoculation was done after 55 days of transplantation, in the morning on cloudy days. The inoculums were prepared as described by Bonman and Mackill [23].
Rice genotypes were screened against BLB following SES IRRI 2013 protocol. The BLB scoring was done twice, first, two weeks after inoculation and second three weeks after inoculation:
|
Disease assessment
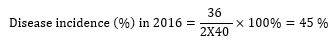
The percentage of disease incidence was calculated using the formula
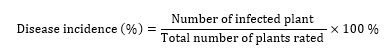

The disease index (DI) was determined using formula

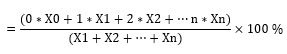
where,
0-n=Number of the rating scale
X0-Xn=Number of plants


3.6. Weather data
Weather parameters like maximum and minimum temperature (0C), total rainfall (mm), number of rainy days, average number of sunshine hours, average wind velocity (Km/hr) and relative humidity (%) of Kharif 2016 and 2017 were obtained from the weather station of the Department of Meteorology, College of Agriculture, Govind Ballabh Pant University of Agriculture and Technology, Pantnagar.
3.7. Statistical analysis
Statistical analysis of two seasons experimental trials transplanted in the randomized complete block design with two replications was done through MSTAT-C statistical software program. Correlation and regression analysis were done by correlating the mean yield of rice genotypes with the average temperature of that year through MS-Excel 2003 software program. Similarly, other traits of the rice including days to flowering, days to maturity, effective tiller per plant, fertile and sterile grain per plant were also correlated with average temperature. The Pearson correlation coefficient was also calculated [14]. The formula used for calculating correlation coefficient was
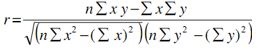
Where x and y are the value of variables, and n is the size of the sample.
Results
Characterization of rice genotypes
The tested rice genotypes were statistically highly significant (p<0.05) based on rice traits days to flowering, days to maturity, effective tillers per plant, panicle length, fertile and sterile grain number per panicle and grain yield per plot in 2016 and 2017 (Table 2). The mean grain yield of rice genotypes in 2016 and 2017 was 10153.85 kg/ha and 5598.38 kg/ha respectively. The mean yield difference between the two seasons was 4555.5 kg/ha. The average yield of rice genotypes in 2016 was 44.86 % higher than 2017. Genotype yields were found more consistent in 2016, with a coefficient of variation 16.34 % than 2017 (coefficient of variation 21.45 %). The least significant difference of the yield in 2016 and 2017 was 3356 kg/ha and 2429 kg/ha at 5% level of significance (Table 3).
Table 2: Analysis of variance statistics of traits of forty IRON rice genotypes transplanted during Kharif 2016-2017. (Significant codes: all treatments show significant value at 0.05 level of significance, *=significant; **=highly significant) (a: DTF=Days to flowering, DTM=Days to maturity, TILN=Tiller number per five plants, PANL=Mean panicle length per five plants, FGP= Fertile grain number per five panicles, SGP=Sterile grain number per five plants and GYLD= Grain yield in kg/ha; Df=Degree of freedom, the MSS=mean sum of a square; Prob.=probability) |
|||||||||||||||||||||||||||||||||||||||||||||||||||||||||||||||||||||||||||||||||||||||||||||||||||||||||||||||||||||||||||||||||||||||||||||||||||||||||||||||||||||||||||||||||||||||||||||||||||||||||||||||
Table 3: IRON rice genotypes and their characterization based on different traits transplanted in 2016 and 2017. (Abbreviations: DTF=Days to flowering, DTM=Days to maturity, TILN=Tiller number per five plants, PANL=Mean panicle length per five plants, FGP= Fertile grain number per five panicles, SGP=Sterile grain number per five plants and GYLD= Grain yield in kg/ha; CV (%) =coefficient of variation, LSD=least significance difference) |
||||||||||||||||||||||||||||||||||||||||||||||||||||||||||||||||||||||||||||||||||||||||||||||||||||||||||||||||||||||||||||||||||||||||||||||||||||||||||||||||||||||||||||||||||||||||||||||||||||||||||||||||||||||||||||||||||||||||||||||||||||||||||||||||||||||||||||||||||||||||||||||||||||||||||||||||||||||||||||||||||||||||||||||||||||||||||||||||||||||||||||||||||||||||||||||||||||||||||||||||||||||||||||||||||||||||||||||||||||||||||||||||||||||||||||||||||||||||||||||||||||||||||||||||||||||||||||||||||||||||||||||||||||||||||||||||||||||||||||||||||||||||||||||||||||||||||||||||||||||||||||||||||||||||||||||||||||||||||||||||||||||||||||||||||||||||||||||||||||||||||||||||||||||||||||||||||||||||||||||||
Compared with the check Pant Dhan-4, only 31 genotypes flowered earlier in 2016 and 2 genotypes in 2017 whereas 28 genotypes matured earlier in 2016 and 2 genotypes in 2017. Similarly, 15 genotypes were observed higher tillers in 2016 and 11 genotypes in 2017. The longer panicle length was observed in 16 genotypes in 2016 and 11 genotypes in 2017. Fertile grain number was also high (32 genotypes) in 2016 than 2017 (23 genotypes). But only 22 genotypes had higher yield in 2016 than in 2017 (38 genotypes) (Figure 1)
|
Figure 1: Comparison of rice genotypes based on yield with Pant Dhan-4, a check variety through error bars diagram. |
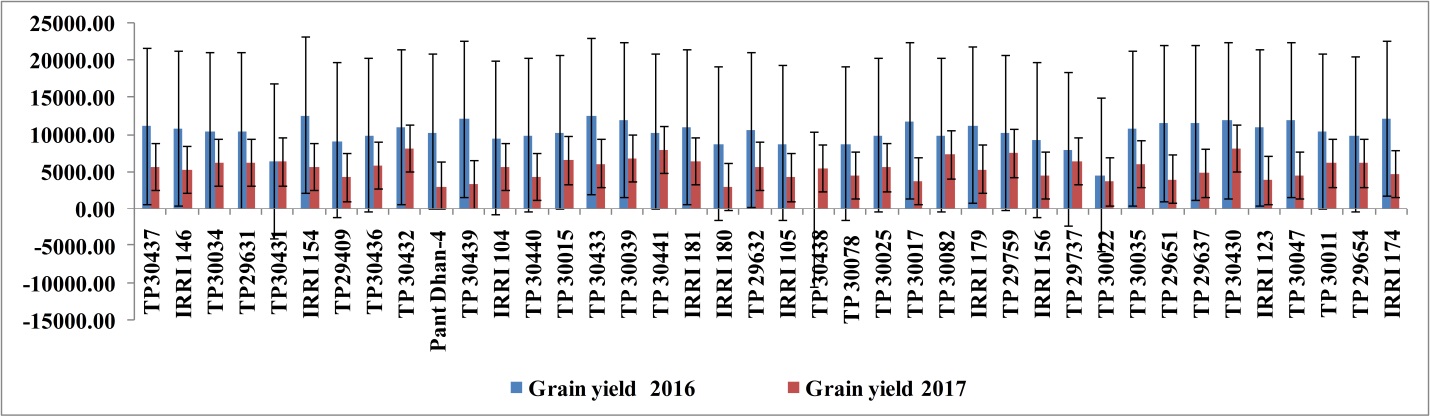
We found maximum grain yield in IRRI 154 (12696 kg/ha), followed by TP 30433 (12568 kg/ha), IRRI 174 (12212 kg/ha) and minimum in TP 30438 (0 kg/plot) in 2016. Similarly, TP 30430 (8281.28 kg/ha) had maximum yield followed by TP 30432 (8260.39 kg/ha), TP 30441 (8103.09 kg/ha) and minimum in IRRI 180 (3000.09 kg/ha) in 2017 (figure 1). TP 30438 did not flower in 2016, so it had zero yields (table 3).
The average days to flowering of all genotypes in both years were the same (105 days), but the average days to maturity of rice genotypes in 2016 (140 days) was higher than 2017 (128 days) (table 3). The longest period of days to flowering and maturity were observed in TP 29632 (126 days) and TP 30022 (153 days) in 2016, and TP 30082 (112 days) and TP 29654 (137 days) in 2017 respectively. Similarly, minimum maturity days was observed in TP 30034 (120 days) in 2016 and TP 30436 (124 days) in 2017.
The average effective tillers were higher in 2016 (16 tillers) than 2017 (10 tillers). On a genotype basis, effective tillers (20 tillers) was found maximum in TP 30017, IRRI 179, TP 29631 and IRRI 123 and longest panicle size was observed in IRRI 181 (26.95 cm) in 2016. In the same way, IRRI 179 (18 tillers) had maximum tillers per genotypes and TP 30078 (25.9 cm) had longest panicle size in 2017 respectively. The average panicle size was also found higher in 2016 (26.25 cm) than 2017 (22.1 cm). Similarly, the average fertile grain per panicle was also higher in 2016 (91) than 2017 (77). TP 30431 had the highest fertile grain per panicle in both 2016 (140) and 2017 (113). In the same way, the average highest observed sterile grain per genotype was in 2016 (32) than 2017 (19). Maximum sterile grain was reported in TP 30034 (62) and TP 30022 (40) in 2016 and 2017 respectively (table 3).
Relationship between temperature, yield and its attributing traits
The mean yield of rice genotypes (10153.85 kg/ha in 2016 and 5598.38 kg/ha in 2017) and average temperature (26.89 0C in 2016 and 27.67 0C in 2017) were negatively correlated (-1). The Pearson correlation coefficient value was also negative (-0.99) in both years of the experiment. Similar to the yield and temperature relationship, other rice traits including days to maturity, effective tiller, panicle length, fertile and sterile grain per panicle were negatively correlated to temperature. But days to flowering was positively correlated with the average temperature of that season; meaning that the higher the temperature, is the higher the chance of fast flowering. The 2016 rice genotypes showed delayed flowering and maturity compared to 2017 genotypes potentially due to the effect of temperature. The average temperature of 2016 was lower than 2017. The regression equation is expressed in logarithm because yield is a dependent variable, the value is expressed in a relative term5. Regression coefficient (R2 =1) was positive in both year of experiments, revealed the fact that all values of yield lie near the value of temperature, means the temperature is highly correlated with yield components (Figure 2).
|
Figure 2: Regression relationship between average temperature and mean grain yield of rice genotypes of 2016 and 2017. The X-axis shows average temperature (0C) and Y-axis shows mean grain yield (kg/ha). The regression coefficient value is positive. |

BLB infestation and disease assessment
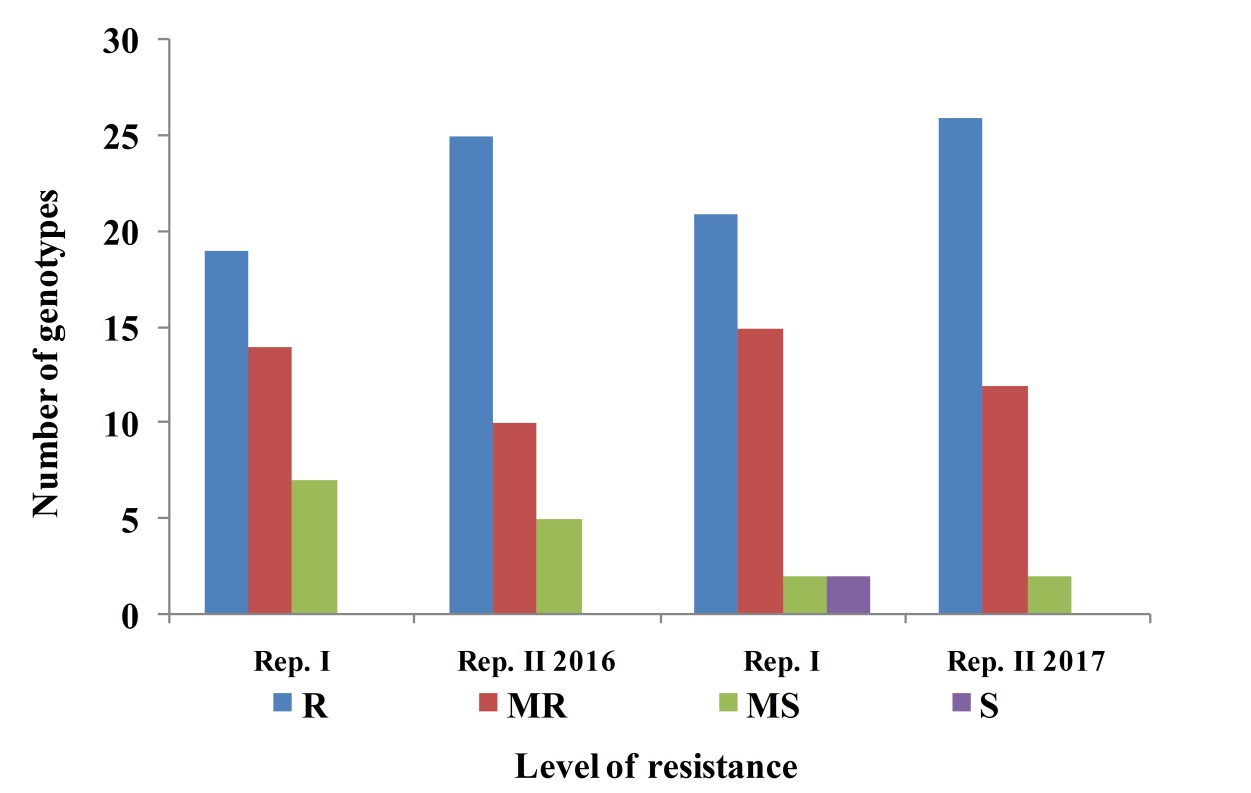
BLB scoring of rice genotypes was done based on disease leaf area. Only 4 genotypes were found completely resistant in both years of BLB scoring (table 1). A combined 2-year analysis of data showed that 56.87 % genotypes were resistant, 31.87 % moderately resistant, 10 % moderately susceptible, and only 2.50 % were susceptible (Figure 3). The common genotypes which were screened with the same scoring value from two replications were, 13 resistant, 3 moderately resistant and 4 moderately susceptible in the initial year of experiment whereas 15 resistant, 7 moderately resistant and, 1 moderately susceptible of total 40 genotypes in the second year of the experiment. TP 29409 and TP 30436 was scored as susceptible in one replication whereas both were scored resistant in another replication in 2017. Only four genotypes were common which were found completely resistant in both years of screening. On yield basis, IRRI 146 (8154.33 kg/ha) had maximum average yield followed by TP 29651 (7855.08 kg/ha), TP 29632 (8269.63 kg/ha) and IRRI 104 (7672.65 kg/ha) etc.
Disease incidence was calculated based on the number of infected plants to the total plants per plot. The disease index and percentage of disease incidence were 44 and 45% in 2016 and 28.92 and 41.25% in 2017 respectively.
|
Figure 3: Bacterial leaf blight (BLB) infestation in rice genotypes in 2016 and 2017. BLB is classified into five distinct classes; Resistant (R), Moderately resistant (MR), Moderately susceptible (MS), Susceptible (S), and Susceptible (S) based on leaf area infected per plant. |
Weather data interpretation
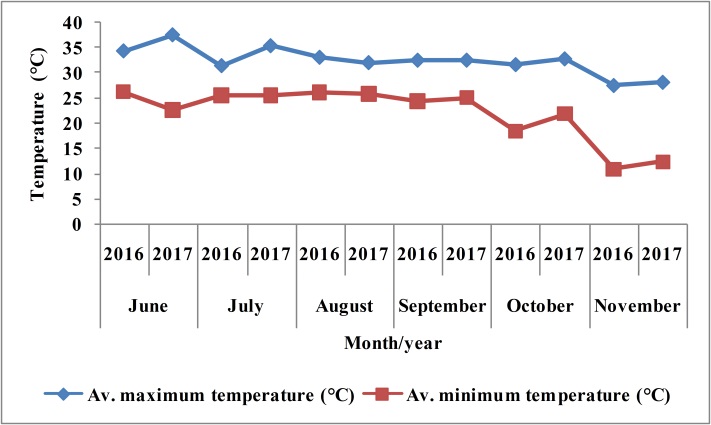
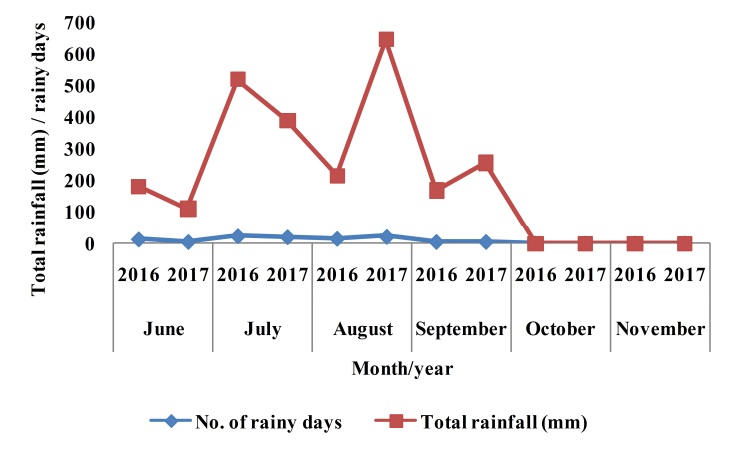
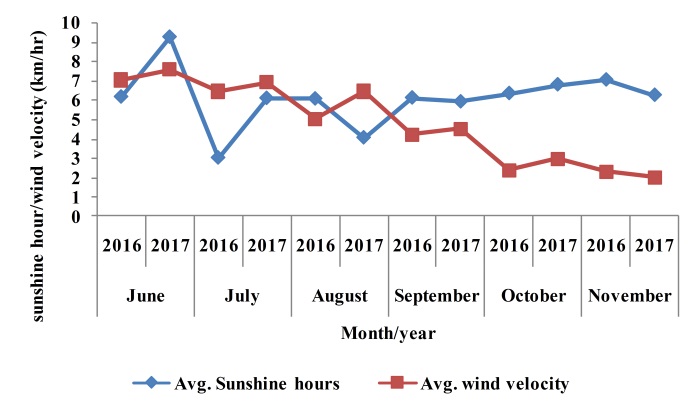
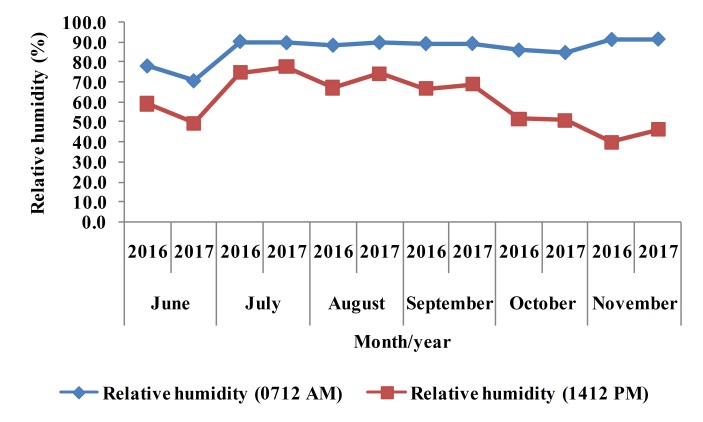
The average maximum (33.12 0C) and minimum temperature (22.22 0C) of Kharif 2017 were higher than the average maximum (31.81 0C) and minimum temperature (21.96 0C) of Kharif 2016 (Figure 4). The mean temperature difference between the two years was 0.78 0C. Similarly, the minimum (night time) temperature difference between two seasons was 0.26 0C only. But there was 3.410C rise in minimum night temperature during grain filling period in Kharif 2017 (October) than the initial year of the experiment (figure 4). High rainfall (338.95 ml) and 13 rainy days recorded in 2017 as compared to 259.52 ml rainfall and 14 rainy days in 2016. Though high rainfall recorded in Kharif 2017 but most rainfall occurred at the time of transplanting only. Highest maximum and minimum temperature were recorded in June during which rice tillering starts. The soil moisture was below the field capacity during grain filling period in 2017. The average relative humidity of both seasons was nearly same (73.7 %).
|
Figure 4: Weather parameters recorded at Norman E. Borlaug Crop Research Centre Weather Station, G. B. Pant University of Agriculture and Technology, Pantnagar India during Kharif season 2016-2017. Figure 4a Average maximum and minimum temperature, Figure 4b Number of rainy days and total rainfall (mm), Figure 4c Average sunshine hour and wind velocity (km/hr), Figure 4d Relative humidity. All the weather parameters are expressed in month/year. |
Discussion
The mean yield of total rice genotypes in 2016 was higher than 2017, though disease epidemics were high in the initial year of the experiment (table 3). The increase in yield might be due to favourable weather conditions, optimum temperature during grain filling period, more days of sunshine, and the minimum night temperature which causes less loss of photosynthates [24]. The maximum and minimum temperature of Kharif 2016 was 31.81 0C and 21.96 0C which were ideal for rice productivity. Nyangau and Samui [25,26] suggested the ideal maximum and minimum temperature for rice ranges of 29-32 0C and 23-25 0C for optimum yield. But we reported a rise in minimum night temperature by 3.41 0C and soil water below field capacity during grain maturity period in 2017 compared to 2016 (figure 4). The yield decline in 2017 might be due to the rise in night temperature that decreases the percentage of ripened grains and increases the percentage of sterile spikelets [27-29,13,12]. Peng et al. [14] reported that grain yield declined by 10% for each 1 0C increase in minimum temperature, whereas the effect of maximum temperature on crop yield was insignificant. Welch et al. [10] and Cheng et al. [30] also said higher minimum temperature reduced yield, and the higher maximum temperature raised it. Rao et al. [7] found 57.2 % Indian rice area was influenced by the rise in minimum temperature, and rice yields declined by 411 to 859 kg/ha/0C rise from the 1971-2009 period. Krishnan et al. [31] support the above facts that high temperature limits rice productivity, causing reductions in grain weight and quality. Rice productivity decreased due to increase in temperature could be overcome by altering the sowing time, maintaining the soil water level up to field capacity at grain filling period and by the selection of genotypes that possess a higher potential of spikelet fertility at high temperatures [13]
The mean days to maturity of the crop in 2016 (139 days) was higher than 2017 (128 days). The increase in maturity days of the crop in the initial year of experiment might be due to lower weather temperature than 2017 (figure 4) [9,14]. Similarly, other rice traits such as effective tillers, panicle length, and fertile grain were also higher in the initial year of the experiment which might be due to the favourable temperature obtained during the rice growing stage [25]. Ohe et al. [32] and Yang et al [27] also reported that plant height was taller, and the maximum tillering stage was earlier at higher temperatures and the photosynthetic rate was lower because of the acceleration of leaf senescence. Cheng et al. [30] also found larger enhancement of photosynthesis at a higher temperature and elevated CO2. However, increased night temperature can counter this because of the heavier respiratory cost, increased by the larger biomass [29]. We found that some rice genotypes (heat tolerant) performed very well and had higher productivity even at higher minimum temperature, but most genotypes showed a negative response to rise in minimum night temperature. The findings confirm that climate variables exert significant effects on rice yields but these effects vary among rice genotypes [33]. Cao et al. [11] also found relatively high yield in heat tolerant genotypes under high-temperature stress was associated with low leaf temperature, high root activity, and high ATPase activity in grains.
The disease index and disease incidences were 15.08 and 3.75% higher in 2016 than 2017. It might be due to more rainy days followed by maximum temperature, humidity and wind run [34]. Disease epidemics depend on the type of genotypes, weather condition and agronomic management, provided host and inoculum are present. Suresh et al. [19] found a significant positive correlation between disease development and maximum temperature, but minimum temperature and relative humidity had no much impact on it. Epidemics that began before panicle initiation significantly reduced grain yield, panicle fertility and kernel weight [35]
Conclusion
Temperature exerts a profound effect on crop production and productivity. Rice productivity could be reduced not only due to improper agronomic management and biotic factors but might also be due to elevated night-time temperatures. Each year, rice productivity fluctuates and one of the major reasons is elevated minimum temperature. We found a slight rise in night temperature was more detrimental to rice productivity than moderate BLB infestation. Rice productivity could be enhanced by altering sowing time and minimizing night temperature by maintaining soil water level up to field capacity at grain filling period. BLB might be a serious problem in rice-growing areas, especially if high temperature is followed by longer rainy days. The results also reveal that Pantnagar, Uttrakhand rice is severely affected by extreme temperature, thus selection of heat tolerant varieties with good agronomic practices can help to achieve optimum productivity.
Acknowledgement
I am highly acknowledged to Dr. Shiri Diskin, writing instructor and consultant, Israel for her critical comments and help to shape the manuscript.
Conflict of interest
We confirm that there are no known conflicts of interest associated with this publication. The manuscript has been read and approved by the named author.
References
- United Nations Food and Agriculture Organization.
- MAFW, Annual Report 2016-17 Department of Agriculture, Cooperation, and Farmers Welfare, Ministry of Agriculture and Farmers Welfare, Government of India, Krishi Bhawan, New Delhi-110 001.
- Thanh NC, Singh B (2006) Constraints faced by the farmers in rice production and export. Omonrice 14: 97-110.
- Islam MS, Morison JIL (1992) Influence of solar radiation and temperature on irrigated rice grain yield in Bangladesh. Field Croprs Res 30: 13-28.
- Auffhammer M, Ramathan V, Vincent JR (2012) Climate change, the monsoon, and rice yield in India. Climatic Change 111: 411-424
- Padma Kumari B, Londhe AL, Daniel S, Jadhav DB (2007) Observational evidence of solar dimming: offsetting surface warming over India. Geophys Res Letter 34: L21810.
- Rao BB, Chowdary PS, Sandeep VM, Rao VUM, Venkateshwarlu V (2014) Global and Planetary Change 117: 1-8.
- Hingane LS, Kumar KR, Murty BVR (1985) Long-term trends of surface air temperature in India. Int J Climatol 5: 521-528.
- Shrivastava P, Saxena RR, Xalxo MS, Verulkar SB (2012) Effect of high temperature at different growth stages on rice yield and grain quality traits. J Rice Res 5: 29-42.
- Welch JR, Vincent JR, Auffhammer M, Moya PF, Dobermann A, et al. (2010) Rice yields in tropical/subtropical Asia exhibit large but opposing sensitivities to minimum and maximum temperatures. PNAS 107: 14562-14567.
- Cao YY, Duan H, Yang N, Wang ZQ, Liu LJ, Yang JC (2009) Effect of high temperature during heading and early filling on grain yield and physiological characteristics in Indica rice. Acta Agronomica Sinica 35: 512-521.
- Mohammed AR, Tarpley L (2010) High night temperature and plant growth regulator effects on spikelet sterility, grain characteristics and yield of rice (Oryza sativa L.) plants. Canadian J Plant Sci 91: 283-291.
- Krishnan P, Swain DK, Bhaskar BC, Nayak SK, Dash RN (2007) Impact of elevated CO2 and temperature on rice yield and methods of adaptation as evaluated by crop simulation studies. Agri Echosys Ecol 122: 233-242.
- Peng S, Huang J, Sheehy JE, Laza RC, Visperas RM, et al. (2004) Rice yields decline with higher night temperature from global warming. PNAS 101: 9971–9975.
- Perez LM, Redona ED, Mendioro MS, Vera Cruz CM, Leung H (2008) Introgression of Xa4, Xa7, and Xa21 for resistance to bacterial blight in thermosensitive genetic male sterile rice (Oryza sativa L) for the development of two-line hybrids. Euphytica 164: 627-636.
- Arshad HMI, Naureen S, Saleem K, Ali S, Jabeen T, Babar MM (2015) Morphological and biochemical characterization of Xanthomonas oryzae PV. oryzae isolates collected from Punjab during 2013. Adv. Life Sci. 3: 125–130.
- Singh S, Chand S, Singh NK, Sharma TR (2015) Genome wide distribution, organization and functional characterization of disease resistance and defense response genes across rice species. PLoS ONE 10:e0125964.
- Triny SK, Hanarida I, Utami DW, Koerniati S, Ambarwati AD et al. (2007) Evaluation of resistance of double haploid population of crosses between IR64 and Oryza rufipogon to bacterial leaf blight on seedling stadia. Bulletin Plasma Nutfah 15: 13-19.
- Suresh SR, Yenjerappa ST, Naik MK, Mallesh SB, Amaresh YS (2013) Role of weather factors on bacterial leaf blight development in paddy. Environ Ecol 31: 1593-1595.
- Shanti ML, Shenoy VV (2005) Evaluation of resistance genes and their pyramids against rice bacterial leaf blight pathogen Xanthomonas oryzae pv. oryzae. Oryza 42: 169–173.
- Ali S, Baratali F, Noroozi M, Gudarzi KM (2014) Leaf blight resistance in rice: a review of breeding and biotechnology. Int J Farm Allied Sci 3: 895-902.
- Yasmin S, Hafeez FY, Mirza MS, Rasul M, Arshad HMI, et al. (2017) Biocontrol of bacterial leaf blight of rice and profiling of secondary metabolites produced by Rhizospheric Pseudomonas aeruginosa BRp3. Front Microbiol 8: 1895.
- Bonman JM, Mackill DJ (1988) Durable resistance to rice blast disease. Oryza 25: 103-110.
- Samol P, Umponstira C, Klomjek P, Thongsanit P (2015) Responses of rice yield and grain quality to high temperature in the open-top chamber to predict the impact of future global warming in Thailand. Australian J Crop Sci 9: 886-894.
- Nyangau WO, Mati BM, Kalamwa K, Wanjogu RK, Kiplagat LK (2014) Estimating rice yield under changing weather conditions in Kenya using CERES rice model. Int J Agronomy 2014: 849496.
- Samui RP (1999) A note on the weather and rice yield relationship at some stations in India. PNAS 108: 309-316.
- Yang Z, Zhang Z, Zhang T, Fahad S, Cui K, et al. (2017) The Effect of Season-Long Temperature Increases on Rice Cultivars Grown in the Central and Southern Regions of China Front. Plant Sci 8: 1908
- Shi W, Muthurajan R, Rahman H, Selvam J, Peng S, et al. (2013) Source-sink dynamics and proteomic reprogramming under elevated night temperature and their impact on rice yield and grain quality. New Phytologist 197: 825–837.
- Yoshida S (1973) Effects of temperature on growth of the rice plant (Oryza sativa L.) in a controlled environment. Soil Science and Plant Nutrition 19: 299-310.
- Cheng W, Hidemitsu Sakai Kazuyuki and Yagi Toshihiro Hasegawa (2009) Interactions of elevated [CO2] and night temperature on rice growth and yield. Agri Forest Meteorol 149: 51-58.
- Krishnan P, Ramakrishnan B, Reddy KR, Reddy VR (2011) High-temperature effects on rice growth, yield, and grain quality. In Donald L. Sparks, editor: Advances in Agronomy, Burlington: Academic Press 111: 87-206.
- Ohe I, Saitoh K, Kuroda T (2007) Effects of high temperature on growth, yield and dry-matter production of rice grown in the paddy field. Plant Production Science 10: 4
- Sarker Md J, Alam AR, Gow J (2012) Exploring the relationship between climate change and rice yield in Bangladesh: An analysis of time series data. Agricultural Systems 112: 11-16.
- Roberts SJ (1997) Effect of weather conditions on local spread and infection by pea bacterial blight (Pseudomonas syringae pv. pisi). European Journal of Plant Pathology 103: 711–719.
- Reddy APK, MacKenzie DR, Rouse DI, Rao AV (1979) Relationship of bacterial leaf blight severity to grain yield of rice. Phytopathology 69: 967-969.