 LOGIN
LOGIN REGISTER
.png)


Case Study
Physicochemical Appraisal of Effluents Receiving Stream: A Case Study of Mvudi River, South Africa
Gitari WM1*, Tshikovhi FP1 and Akinyemi SA2
1Environmental Remediation and Water Pollution Chemistry Group, Department of Ecology and Resources Management, School of Environmental Sciences, University of Venda, Thohoyandou, South Africa
2Department of Geology & Applied Geophysics, Faculty of Science, Ekiti State University, Ado Ekiti, Nigeria
*Corresponding author: Wilson Mugera Gitari, Environmental Remediation and Water Pollution Chemistry Group, Department of Ecology and Resources Management, School of Environmental Sciences, University of Venda, Thohoyandou, 0950, South Africa, Tel: +27 159628572; E-mail: mugera.gitari@univen.ac.za
Citation: Gitari WM, Tshikovhi FP, Akinyemi SA (2017) Physicochemical Appraisal of Effluents Receiving Stream: A Case Study of Mvudi River, South Africa. J Environ Sci Allied Res 2017: 25-31. doi:https://doi.org/10.29199/2637-7063/ESAR-101014
Received Date: 01 August, 2017; Accepted Date: 18 September, 2017; Published Date: 03 October, 2017
Abstract
The impact of discharged treated wastewater effluents on the physicochemical parameters of Mvudi River was appraised over the period of July to September 2012. Physicochemical parameters measured included pH, electrical conductivity, total dissolved solids, chemical oxygen demand, total organic carbon, nitrate, and orthophosphate. The parameters were concurrently monitored in the treated final effluents and the receiving stream. High levels were observed for chemical oxygen demand, nitrate, orthophosphate, total organic carbon, conductivity, total dissolved solid during winter and spring seasons. They were above prescribed limits as stipulated by Department of Water Affairs-South Africa and World Health Organisation for treated waste water effluents. Low pH was observed for discharged effluents which could be attributed to organic acids produced in the anaerobic digestion of the sewage effluents. The study indicated moderate impact of the poorly treated effluents on the physicochemical properties of Mvudi River. High levels of nutrients and high COD, TOC observed could lead to eutrophication and oxygen depletion respectively and thus endanger aquatic organisms. Municipal authorities should ensure the discharged treated effluents to Mvudi River are within the stipulated guidelines. This could be managed through frequent optimization of the treatment processes and procedures employed in the Waste Water Treatment Plant.
Keywords: Chemical Oxygen Demand; Conductivity; Mvudi River; Orthophosphate; Total Organic Carbon; Treated Wastewater Effluents
Introduction
Several studies have shown that disposal of sewage waste from Waste Water Treatment Plant is a major problem around the world which is degrading the water quality since it is more likely to pose environmental stress [1-6]. Effluents discharged into water body can also contain hazardous substances which in turn result in upsetting or degradation of the ecological balance of rivers [7]. From a social perspective, the discharge of effluents into water body can pose negative impacts on human health, primarily from bacteriological and other forms of pathogens that survive in the biological treatment process and inadequate treatment of the effluents [1,2]. Sewage discharges is mainly associated with loading of nutrients such as nitrate and phosphate to the water bodies, hence promoting accelerated growth of toxic algal blooms and leading to a destabilized aquatic ecosystem [8]. The majority of waterborne microorganisms that cause human disease come from sewage waste water. These contain a wide variety of viruses, bacteria, and protozoa that may get washed into drinking water supplies or receiving water bodies [9]. Moreover, Sewage wastewater also carries microbial pathogens that spread many diseases such as diarrhoea, hepatitis, typhoid fever, shigellosis, salmonellosis, campylobacteriosis, giardiasis, cryptosporidiosis and cholera from consumption of water contaminated with pollutants from Waste Water Treatment Plant [10].
Water pollution by effluents from Waste Water Treatment Plant is associated with heavy disease burden [11] and this could significantly influence the current problem of shorter life expectancy more especially in developing countries such as South Africa. The susceptibility of residents of rural communities in South Africa to disease loaded contaminated water is due to lack of adequate sanitation and water supply infrastructures, economic and technological constraints to adequately treat the available water before use [12,13].
South Africa has a population of 49.4 million people, 52% of whom are estimated to be living in the rural communities [14]. Of this part of the population, 6.0 million still don’t not have access to a reliable source of drinking water [15]. This implies that a large part of communities in rural areas depend on untreated surface and groundwater sources for their daily water need [16]. In recent decades, sewage discharge has been reported to be problematic in South Africa since there are inadequate wastewater treatment facilities even though several efforts are being vigorously pursued to control and manage wastewater. The problem is amplified in areas where wastewater treatment systems are simple, ineffective and inefficient. Treatment and assessment of river water and wastewater plays a crucial role in safeguarding public health and the environment [17]. Therefore, whichever level of treatment and method of disposal should strictly comply with national water quality guideline standards and internationally accepted environmental quality criteria, taking into account the recipient environment and the biological targets which may be affected by such water [18].
The treated sewage effluent from Muledane waste water treatment plant are discharged into water bodies are more likely to pose hazardous effects to aquatic organism since they are ladened with elevated concentration of pollutants such as phosphates and nitrates which can potentially accelerate algae bloom and in turn deplete the water dissolved oxygen. This study will provide awareness to the Municipality environmental authorities about the impacts posed to Mvudi River ecosystem due to the effluents discharged into the river. The aim of the study was to assess the impact of discharged treated municipal wastewater effluents on the physicochemical properties of the receiving water and evaluate the correlation of the various parameters.
Materials and Methods
Study site and plant description
The Mvudi River is situated between Longitudes E030° 28' 499'' - 030° 28' 640'' and Latitudes S23° 00' 028'' -S23° 00' 100'' within Muledane area in Vhembe district, Limpopo Province of South Africa. Figure 1 shows the sampling points along the river.
|
Figure 1: Map of the study area showing the sampling points: A-upstream, B-effluent discharge point and C-downstream. |
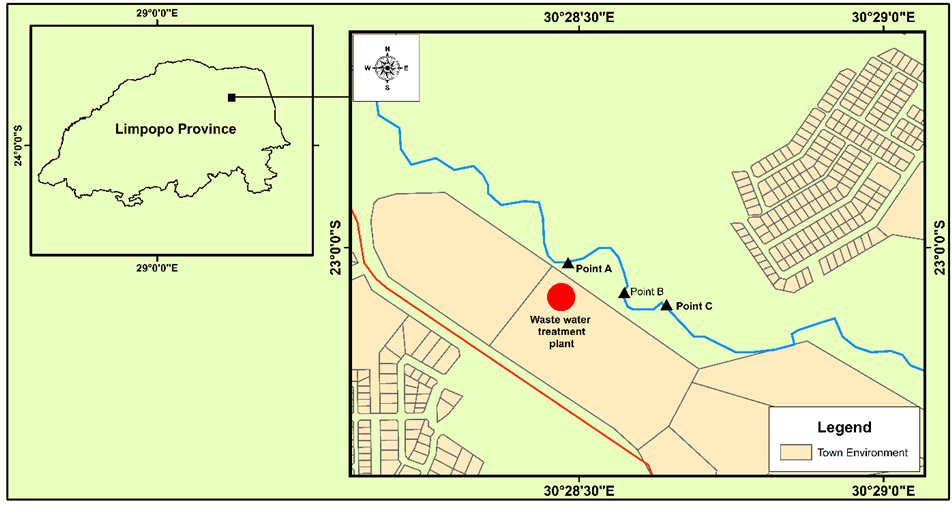
The Mvudi River joins the Dzindi River which in turn is a tributary of Luvuvhu River. The sewage treatment plant is situated south of Mvudi River. The sewage treatment plant which has design capacity of 6 mega litres per day receives domestic sewage effluents, some light industrial wastewater, as well as run-off water and treatment is based on the activated sludge system. The treated final effluent is discharged into the Mvudi River.
Description of sampling stations and sample pre-treatment
Four sampling localities were selected and they were named upstream, effluent, discharge point and downstream respectively. The distance between sampling localities was 100m apart. Samples were collected between July (i.e., winter), August and September (i.e., spring) 2012. Samples were collected in glass containers, pre-cleaned by tap water and finally rinsed by MilliQ (18 Ω cm-1) water. In each selected site samples were collected in triplicate to ensure precision of the results and the sampling containers were filled to the top to avoid further reaction of samples with atmospheric gases and to avoid the presence of air that might chemically or biologically alter the sample [19].
Physicochemical analysis
All laboratory probes and equipments were checked and calibrated according to the manufactures specification. pH, electrical conductivity, Total Dissolved Solids (TDS) of the samples were determined using a CRISON model mm40 Multimeter probe. The concentrations of orthophosphate as P, nitrate, Total Organic Carbon (TOC) and Chemical Oxygen Demand (COD) were determined in the laboratory by the standard photometric method [18] using the Spectroquant NOVA 100 photometer (Merck Pty Ltd). Samples for COD analysis were digested with a Thermo reactor model TR 620 (Merck Pty Ltd.) and then analyzed by the Spectroquant NOVA 100 photometer (Merck Pty Ltd.). Blank determinations were performed for COD, nitrate, nitrite and orthophosphate and results were adjusted for blank measurement in the presented results. New standards were created for each parameter during every measuring month.
Statistical analysis
The obtained data was subjected to descriptive statistical analysis (95 % confident limit) and Pearson correlation coefficient using statistical Package for the Social Sciences (SPSS version 17). SPSS Statistics 17.0 is a comprehensive system for analyzing data. In previous studies, statistical analysis using multivariate data from river system have been used to describe environmental classification which in-turn provides better understanding of the chemical processes and difference in environmental variables, nutrient concentrations in the river system [20-22]. In this study, for better understanding of natural and anthropogenic fluxes responsible for characterization of river water quality, we employed Pearson correlation coefficient analysis on the water quality data. Pearson’s correlation coefficient assumes that each pair of variables is bivariate normal and it is a measure of linear association.
Results
The results of the physicochemical parameters of samples from the different sampling points are as shown in (Table1).
Table 1: Seasonal variation in the concentrations of physico-chemical parameters for the four sampling points in Mvudi River. Values are means of triplicates ± Standard Deviations (SD). Samples collection dates: Winter=26th July, 2012; Spring1=10th August, 2012; Spring2=31st August, 2012; Spring3=13th September, 2012; Spring4=20th September, 2012. |
pH
The pH profile varies significantly in the sampling points throughout the study period and ranged from 6.01 to 7.95 during winter and 6.2 to 7.18 during spring. pH of the treated final effluent varies between 5.54 and 7.06 and had the lowest pH recorded. At discharge point, which is also the mixing zone of the treated effluents with river water, the pH varied from 6.2 to 7.2. At downstream point, the pH varied from 7.00 to 7.95 (Table 1).
Electrical Conductivity (EC)
The electrical conductivities of the stream water generally vary throughout the study period and range from 17.17 to 44.27μS/cm during winter and 18.18 to 730.33μS/cm during spring. EC of the treated final effluent varies between 80.43 to 642.33μS/cm. At discharge point, which is also the mixing zone with river water the EC varied from 39.4 to 316 μS/cm. Downstream point EC varied from 67.8 to 730 μS/cm and upstream recorded the lowest EC levels (17 to 136.5 μS/cm). Highest values were observed during early spring in all sampling points (136.5 to 730 μS/cm) (Table 1).
Total Dissolved Solid (TDS)
The Total Dissolved Solid (TDS) profile of the receiving water body samples vary significantly and ranged from 11.04 to 41.37 mg/L during winter season and 25.17 to 467.33 mg/L during spring season (Table 1). The TDS for the discharged effluents varied from 53-410 mg/L, at the discharge point which is also the mixing zone the levels varied from 28 to 202 mg/L, downstream levels varied from 41 to 467 mg/L while at the upstream sampling point the levels varied from 11 to 88 mg/L.
Chemical Oxygen Demand (COD)
The Chemical Oxygen Demand (COD) of the stream water samples varied from 27.67 to 83.0 mg/L during winter and 16.0 to 400 mg/L during spring seasons. Throughout, the study period the treated final effluent samples ranging between 250.33 and 400 mg/L. At discharge point, which is the mixing zone with river water levels varied from 48 to 205 mg/L, at downstream point levels varied from 83 to 195 mg/L while at the upstream point the levels ranged from 16-30 mg/L (Table 1).
Total Organic Carbon (TOC)
The Total Organic Carbon (TOC) of the stream water samples varied 12.57 to 58.23 mg/L during winter and 13.40 to 155.3 mg/L during spring. The treated final effluent varies between 76.27 to 330.33 mg/L during the seasons. At discharge point, which is also the mixing zone the levels varied from 45 to 124.9 mg/L, at downstream point the levels varied from 35 to 155.3 while at the upstream point the levels ranged from 8.5 to 28.3 mg/L (Table 1).
Nitrates
The nitrate profile of the receiving water body samples varies significantly and ranged from 16.27 to 23.4 mg/L during winter season and 0.60 to 20.03 mg/L during spring season (Table 1). The treated effluent levels varied from 6.9 to 35.4 mg/L. At discharge point, which is also the mixing zone, the levels varied from 1.3 to 19.3 mg/L, at downstream point the levels varied from 0.8 to 23.4 mg/L while at the upstream point the levels ranged from 0.63 to 16.27 mg/L.
Phosphates
The Orthophosphate concentrations (PO43-) in the stream water varied from 0.50 to 6.37 mg/L during the winter season and 0.28 to 3.98 mg/L during spring season. The treated final effluent mainly had orthophosphate ranges between 5.27 and 20.23 mg/L. At discharge point the levels varied from 1.83 to 10.43 mg/L, at downstream point the levels varied from 1.37 to 13.63 mg/L while at the upstream the levels ranged from 0.37 to 3.2 mg/L (Table 1).
Correlation of physicochemical parameters
The correlations among the physicochemical qualities were calculated and results are presented in table 2. There was no significant correlation observed in pH with COD, TOC and PO43-. pH with EC and TDS registered significant positive correlation (r = 0.016, 0.02, P<0.05). pH with NO3- indicated a negative correlation (r = - 0.453, P < 0.05). Conductivity exhibited positive significant correlation with TDS, TOC and PO43- (r = 0.997, 0.768, 0.767 at P<0.01, respectively). Total Dissolved Solid (TDS) showed positive correlation with TOC, PO43-(r = 0.759, 0.767 at P<0.01, respectively) and COD (r = 0.416 at P<0.05).
Table 2: Correlation coefficient r for the different physicochemical variables for the four sampling points in Mvudi river. *Correlation is significant at the 0.05 level (2-tailed); ** Correlation is significant at the 0.01 level (2-tailed). |
Discussion
These low pH values in the effluent (5.54, table 1) could be attributed to organic acids released through anaerobic decomposition of organic components in the sewage effluents. Chlorination of the treated effluent and formation of dilute hydrochloric and hydrochlorous acids could also drive the pH down [23]. A slight increase in pH is observed at discharge and downstream points confirming the impact of the effluents mixing with the river water. The pH values at all the sampling points and effluents fall within the World Health Organization recommended range of 7.0 to 8.5 and 6.5 to 8.5 for drinking water and water meant for full contact recreation, respectively [24-26]. The neutral to alkaline pH values obtained in most sampling points has similarities with values reported elsewhere [4,27].
Electrical Conductivity trends (EC)
Higher conductivities were observed downstream and this could be attributed to anthropogenic activities on the downstream river catchment for example erosion and release of sediments due to runoff and rainfall. High values were also observed at the discharge points in winter and spring seasons, this variation could be due to the variation in efficiency of the treatment plant and the changing nature of the influents received by the treatment plant. The South African guideline for conductivity in effluent that could be discharged into the receiving water bodies is 250μS/cm [28] and based on this guideline; the effluent quality does not appear to be compliant with the regulation for electrical conductivity. The South African acceptable limit for conductivity in domestic water supply is 70μS/cm [29]. This limit was exceeded in the receiving water body. The conductivity values observed in this study for the sampled period are mirror the findings of previous studies [4,30]. Higher TDS (28 to 202 mg/L, 41 to 467 mg/L, table 1) were observed downstream and at discharge points in winter and spring seasons suggestive of other point sources of pollution entering the receiving water body. The high levels at the downstream point could be attributed to point sources such as runoff and erosion from the river catchment. Low values were observed in the upstream point. The treated final effluent TDS varied from 53.0 to 410.33 mg/L (Table 1) during the study periods. These TDS values fell within the allowed limits of 0 to 450 mg/L [31]. High TDS values can be detrimental to freshwater organisms by causing osmotic stress and affecting the osmoregulatory capability of the organisms [32].
Chemical oxygen demand trends
The observed significant contribution of COD by the effluent and receiving water body agrees with the previous studies by various researchers [4,27,30]. The COD values were higher than the acceptable limits (i.e., 30 mg/L) set by DWAF water quality guideline for effluents designed for discharge into the receiving water bodies [28]. Increased levels of COD were observed at the downstream and discharge points in both seasons when compared with upstream. This could be ascribed to the mixing and dilution effect of effluents by stream water. The increased levels of COD in the downstream point compared to the upstream point could be mainly attributed to the discharge of the treated effluents. The COD levels in the effluent are attributed to organic components from the influent received by the treatment plant which normally has a significant component of sewage from domestic effluents [33]. The continuous discharge of effluent with high COD levels will have adverse effects on the receiving water body. This will ultimately lead to negative effects on the quality of the freshwater and subsequently negative impacts on the aquatic ecosystem and river health downstream [27]. This could also impact on the treatment cost and efficiency of the drinking water treatment plants downstream.
Total organic carbon trends
High TOC levels (76 to 330 mg/L, table 1) in the effluent were observed, these levels decreased in the discharge and downstream point due to mixing and dilution effect of the river water. It should be noted that the TOC levels at the upstream point were the lowest indicating the discharged effluent were the main source of the TOC. At the downstream point the levels were observed to decrease by half, this could be attributed to both dilution effect and microbial breakdown and incorporation of the resulting C in their tissues. The TOC levels in effluent, discharge point and downstream is attributable to organic components in the influent received by the treatment plant.
Nitrate trends
Nitrate is the most highly oxidized form of nitrogen and is commonly present in surface and groundwater because it is the product of aerobic oxidation of ammonia. The South African guideline for nitrate in sewage effluent is 1.5 mg/L NO3- as N [28]. The obtained nitrate concentration values exceeded the recommended limit (6.9 to 35.4 mg/L, table 1). The effluent from the sewage treatment plants could be considered as a source of nitrate into the receiving water body. In the downstream, the nitrate concentration profile was observed to increase gradually, this may be attributed to aerobic decomposition of aquatic flora or contribution from anthropogenic activities on the downstream river catchment.
Orthophosphate trends
Elevated orthophosphate levels were recorded for the discharged effluent (5.27 to 20.23 mg/L, table 1). The levels decreased at the discharge point which is also the mixing zone, this is attributed to dilution and mixing effect of the river water, a slight increase was then observed at the downstream point which could be attributed to anthropogenic activities or release from decaying plant material [4]. However, the level of phosphate in water systems that will reduce the likelihood of algal and other plant growth is 5μg/L [24]. Other investigators have pointed out that eutrophication-related problems in temperate zones of aquatic systems begin to increase at ambient total P concentrations exceeding 0.035 mg/P [23]. Generally, the phosphate-P values were higher during spring season compared to winter season, for the downstream and upstream of the discharge points. This could be attributed to runoff from domestic, municipal, and agricultural waste and seepage from individual sewage treatment systems. Nitrates (NO3-) and phosphorus are essential nutrients to plant life, but when present in excessive quantities, they can stimulate excessive and undesirable plant growth (Eutrophication) such as algal blooms. Eutrophication could unfavorably affect the use of rivers and dams for recreation purposes as the covering of large areas by macrophytes could prevent access to waterways and could cause unattractive and stinking scum which could lead to the growth of blue-green algae and release toxic substances (cyanotoxins) into the water systems. Besides, it is recognised that eutrophication could increase the treatment cost of drinking water through filter clogging in water treatment works [34].
Correlation of physicochemical parameters
The observed pH and NO3- trend agrees with observations from previous study by [4]. The orthophosphate (PO43-) exhibited a positive correlation with COD, NO3- and TOC (r = 0.568, 0.722, 0.856 at P<0.01, respectively, table 2). Positive correlation between physicochemical parameters in the stream water samples could allude to similar sources or causal effect. The positive correlation could also be an indication that the physicochemical parameters are greatly influenced by the sewage treatment activities in the study area. A positive correlation between pH and EC, TDS could be explained by precipitation and formation of metal oxides/hydroxides and subsequent adsorption of chemical species which would cause a decrease in EC and TDS. A positive correlation observed between EC and TDS, TOC, PO43-, charged species such as PO43- contribute to transfer of charges and to TDS, charged organic species that contribute to TOC also contribute to the conductivity of a media, this would explain the positive correlation observed between these parameters and EC.
The impact of discharge of treated municipal waste water plant effluents on the physicochemical parameters of the receiving water body was carried over a period covering winter and spring. Parameters monitored were pH, EC, TDS, COD, TOC, orthophosphates, and nitrates. Peak values of the chemical parameters for all the sampling points were observed in spring. The upstream point recorded the lowest values for all parameters monitored which represented the background concentrations. A gradual decrease in levels for all parameters was observed at the discharge point which confirmed the importance of the mixing and dilution effect of the receiving stream water. This also indicated the treated effluent was the main contributor of these parameters in the receiving stream water.
A peak in TDS, NO3- and PO43- was observed in the downstream point which indicated possible contribution by anthropogenic activities on the downstream river catchment. A significant number of the measured parameters were observed to exceed the prescribed limits for discharge of treated effluents in surface water bodies. This was observed to be a concern especially on the cumulative effect on the river health and negative impact on the drinking water treatment plant downstream. The mixing and dilution effect of the river water was observed to play a significant role in the gradual decrease in the levels of these physicochemical parameters. It is recommended that the waste water treatment plant monitor operation efficiency of the plant and the discharged effluent quality to prevent any adverse effects on the river health.
Conclusion
Several physicochemical parameters were measured over a period of three months to assess the impact of discharge of wastewater treatment plant effluents on a fresh water resource. Results indicated high concentrations of COD, NO3-, PO43-, TOC, EC, and TDS at discharge point and downstream of the discharge point. The fresh water resource was observed to be most sensitive to COD with the levels showing increase at discharge point and downstream of discharge point. This was attributed to the high content of organic matter normally present in municipal sewage effluents. The levels were observed to be higher than DWAF set guidelines for discharge of treated effluents. Continued discharge of the effluents could have a negative impact on the dissolved oxygen and consequently affect survival of aquatic organisms. The high level of nutrients observed could also pose a risk of eutrophication. With subsequent on the quality of the water resource. This study recommends assessment of the impact of discharge of the treated effluents on a longer portion of the river downstream of the discharge point to fully assess the assimmilative capacity of the water resource
Acknowledgements
The authors would like to express their appreciation to the Manager of Tswinga Municipal wastewater treatment plant for access to the facility for effluent sampling. University of Venda, Research and Innovation directorate and ESKOM Foundation for funding the study, Mr. Mhlongo ES (Mining and Environmental Geology, University of Venda) for generating the map of the study area. The analysis were all conducted at Department of Ecology and Resources Management, School of Environmental Sciences, University of Venda, South Africa.
References
- Bahlaoui MA, Baleux B, Troussellier M (1997) Dynamics of pollution-indicators and pathogenic bacteria in high rate oxidation wastewater treatment ponds. Water Resources 31: 630-638.
- Simpson E, Charles K (2000) The health threat posed to surrounding community by effluent discharged from rural hospital sewage treatment plants. Proceedings of the WISA Conference, Sun City, South Africa. 28 May - 1 June.
- Momba MNB, Osode AN, Sibewu M (2006) The impact of inadequate wastewater treatment on the receiving water bodies - Case study: Buffalo City and Nkokonbe Municipalities of the Eastern Cape Province. Water SA 32: 687-692.
- Igbinosa EO, Okoh AI (2009) Impact of discharge wastewater effluents on the physico-chemical qualities of a receiving watershed in a typical rural community. International Journal of Environmental Science and Technology 6: 175-182.
- Ejaz N, Hashmi HN, Ghumman AR (2011) Water Quality Assessment of Effluent Receiving Streams in Pakistan: A Case Study of Ravi River. Mehran University Research Journal of Engineering and Technology 30: 383-396.
- Akpor OB (2011) Wastewater Effluent Discharge: Effects and Treatment Processes. 3rd International Conference on Chemical, Biological and Environmental Engineering (IPCBEE) 20: 85-91.
- Canada Gazzette (2010) Proposed Wastewater Systems Effluent Regulations, Canada Gazette. Regulatory Impact Analysis Statement 144: 12.
- Department of Water Affairs and Forestry (DWARF) and Water Research Commission (WRC) (1995) Procedures to Assess Effluent Discharge Impact, South African water quality management series (ed.). WRC Report No TT 64/94. 1stedn, Department of Water Affairs and Forestry, Pretoria, South Africa.
- Kris M (2007) Wastewater pollution in China.
- World Health Organisation (WHO) (2004) Guidelines for Drinking Water Quality. 3rdedn, Volume 1 Recommendations, World Health Organisation, Geneva, Switzerland. Pg no: 1-515.
- Okoh AI, Odjadjare EE, Igbinosa EO, Osode AN (2007) Wastewater treatment plants as a source of microbial pathogens in the receiving watershed. African Journal of Biotechnology 6: 2932-2944.
- Aina EOA, Adedipe NO (1996) Water quality monitoring and environmental status in Nigeria. FEPA Monograph. Abuja, Nigeria, Federal Environmental Protection Agency (FEPA) 6: 239.
- Lloyd B, Helmer R (1992) Surveillance of drinking water quality in rural areas. Longman Scientific and Technical Publication, J. Wiley, New York, USA. Pg no: 34-56.
- Department of Environmental Affairs and Tourism (DEAT) (2008) State of the Environment Report. Department of Environment Affairs and Tourism, Republic of South Africa.
- Department of Water Affairs and Forestry (DWARF) (2008) Water and sanitation coverage in South Africa. Department of Water Affairs and Forestry, Pretoria, South Africa.
- Mpenyana ML, Onyango MS, Momba MNB (2012) Groundwater quality in a South African Rural Community: A Possible Threat to Public Health. Polish Journal of Environmental Studies 21: 1349-1358.
- Okoh AI, Barkare MK, Okoh OO, Odjadjare E (2005) The cultural microbial and chemical qualities of some waters used for drinking and domestic purpose in a typical rural setting of Southern Nigeria. Journal of Applied Sciences 5: 1041-1048.
- The Department of Water Affairs and Forestry (DWARF) (1999) Quality of domestic water supplies. Sampling Guide 2. WRC Report No. TT 117/99. The Department of Water Affairs and Forestry, The Department of Health and Water Research Commission, Pretoria, South Africa.
- Muniyan M, Ambedkar G (2011) Seasonal Variations in Physicochemical Parameters of Water Collected from Kedilam River, at Visoor Cuddalore District, Tamil Nadu, India. International Journal of Environmental Biology 1: 15-18.
- Vaishali P, Punita P (2013) Assessment of seasonal variation in water quality of River Mini, at Sindhrot, Vadodara. International Journal of Environmental Sciences 3: 1424-1436.
- Abir S (2014) Seasonal Variations in Physico-Chemical Characteristics of Rudrasagar Wetland - A Ramsar Site, Tripura, North East, India. Res J Chem Sci 4: 31-40.
- Fifield FW, Haines PJ (2000) Environmental analytical chemistry. 2ndedn, Wiley-Blackwell, London, UK.
- Pepper IL, Gerba CP, Brusseau ML (1996) Pollution science. Academic Press, California, USA.
- The Department of Water Affairs and Forestry (DWARF) (1996) South African Water Quality Guidelines. Aquatic ecosystems. 1stedn, The Department of Water Affairs and Forestry, Pretoria, South Africa. Pg no: 9-15.
- World Health Organisation (WHO) (1984) Guideline for Drinking Water Quality Recommendation. World Health Organization, Geneva, Switzerland.
- WHO Scientific Group (1989) Health guidelines for use of wastewater in agriculture and aquaculture. World Health Organization Technical Report Series 778. World Health Organization, Geneva, Switzerland.
- Morrison G, Fatoki OS, Persson L, Ekberg A (2001) Assessment of the impact of point source pollution from the Keiskammahoek Sewage Treatment Plant on the Keiskamma River-pH, electrical conductivity, oxygen demanding substance (COD) and nutrients. Water SA 27: 475-480.
- Government Gazette (1984) Requirements for the purification of wastewater or effluent. Government Gazette, South Africa 991 (9225).
- The Department of Water Affairs and Forestry (DWARF) (1996) South African water quality guidelines. Domestic water use. 2ndedn, The Department of water affairs and forestry, Pretoria, South Africa. Pg no: 78-90.
- Fatoki OS, Gogwana P, Ogunfowokan AO (2003) Pollution assessment in the Keiskamma River and in the impoundment downstream. Water SA 29: 183-188.
- Department of Water Affairs and Forestry (DWARF) (1996) South African Water Quality Guidelines. Agricultural water use: irrigation. 2ndedn, Department of Water Affairs and Forestry, Pretoria, South Africa. Pg no: 15-173.
- McCulloch WL, Goodfellow WL, Black JA (1993) Characterization, identification, and confirmation of total dissolved solids as effluent toxicants. In: Gorsuch JW, Dwyer FJ, Ingersoll CG, La Point TW (eds.). Environmental Toxicology and Risk Assessment. Volume 2, STP 1216, American Society for Testing and Materials, Philadelphia, USA. Pg no: 213-227.
- Ogunfowokan AO, Okoh EK, Adenuga AA, Asubiojo OI (2005) An Assessment of the impact of point source pollution from a university sewage treatment oxidation pond on the receiving stream-A preliminary study. Journal of Applied Sciences 5: 36-43.
- Murray K, Du Preez M, Van Ginkel C (2002) South African National Water Quality Monitoring Programmes Series. National Eutrophication Monitoring Programme. Draft Final Report, 2nd Edition, Department of Water Affairs and Forestry, Pretoria, South Africa.