 LOGIN
LOGIN REGISTER
.png)


Original Article
Different Effects of the Insulin Receptor Isoforms on 32D Cell Growth and Differentiation
Laura Sciacca1*, Nunzio Massimo Scalisi1, Maria Francesca Cassarino1, Agostino Milluzzo1, Andrea Tumminia1, Salvatore Sciacchitano2, Lucia Frittitta1, Francesco Frasca1 and Riccardo Vigneri1,3
1Department of Clinical and Experimental Medicine, Endocrinology Section, University of Catania, Garibaldi-Nesima Hospital, Catania, Italy
2Department of Clinical and Molecular Medicine, Sapienza University, Rome, Italy and Laboratory of Biomedical Research, Niccolo? Cusano University Foundation, Rome, Italy
3Institute of Bioimages and Biostructures, CNR, Catania, Italy
*Corresponding author: Laura Sciacca, Department of Clinical and Experimental Medicine, Endocrinology Section, University of Catania, Garibaldi-Nesima Hospital, Catania, Italy, Tel: +39 0957598702; Fax: +39 095472988; E-mail: lsciacca@unict.it
Citation: Sciacca L, Scalisi NM, Cassarino MF, Milluzzo A, Tumminia A, et al. (2017) Different Effects of the Insulin Receptor Isoforms on 32D Cell Growth and Differentiation. J Diabetes Endocrinol Metab Disord 2017: 1-9. doi:https://doi.org/10.29199/DEMD.101013
Received Date: 01 October, 2017; Accepted Date: 16 November, 2017; Published Date: 01 December, 2017
Abstract
The Insulin Receptor (IR) mediates metabolic, mitogenic and differentiation effects. IR exists in two isoforms (IR-A and IR-B) generated by alternative splicing of exon 11. IR-A and IR-B have different binding characteristics and activate partially different intracellular pathways. IR-A, but not IR-B, binds with high affinity IGF-2, a potent mitogenic and anti-apoptotic cytokine. IR-B is the prevalent isoform expressed in differentiated cells while IR-A is predominant in fetal and cancer cells.
In this study, to evaluate the role of IR isoforms in cell growth and differentiation via IRS-3, a recognized mediator of cell differentiation, we co-transfected 32D murine hemopoietic cells with IRS-3 and either IR-A or IR-B. Both isoforms, when activated by insulin, were able to activate cell growth and differentiation programs even in the absence of IL-3, an absolute requirement for 32D cell survival. IR-B was much more effective than IR-A for both functions. IGF-2, although activating IR-A as expected, was not able to stimulate growth via IRS-3 and only minimally differentiation. Finally, to stimulate growth via IRS-3 insulin required for both isoforms the activation of both the ERK and the p70S6K pathways, while to stimulate differentiation the activation of only one pathway was required. In conclusion, via IRS-3, IR-B is much more active than IR-A and IGF-2 has no biological effect even when activating IR-A.
Keywords: Cell Differentiation; Cell Proliferation; Insulin Receptor; Insulin Receptor Isoforms; IRS-3
Introduction
The Insulin Receptor (IR), is a heterotetrameric transmembrane glycoprotein with two a subunits and two b subunits, linked by disulfide bonds. The insulin receptor exists in two isoforms generated by alternative splicing of exon 11: The A isoform is the “short” form generated by exon 11 skipping, and is characterized by the absence of 12 amino acid residues at the carboxyl terminus of the IR a-subunit; the B isoform is the “long” form containing the 12 amino acid residues encoded by exon 11. The two IR isoforms have different functional characteristics. The A isoform (IR-A) is predominantly expressed in de-differentiated tissues (like fetal and cancer tissues), whereas the B isoform (IR-B) is predominantly expressed in differentiated tissues that are typical target of insulin (fat, muscle and liver) [1-6]. In agreement with these characteristics, we also reported that A isoform is associated with osteoblast precursor proliferation, whereas the B isoform is the predominant isoform in mature osteoblasts and is directly related to the differentiation process [7].
Our group for the first time discovered that IR-A binds with high affinity not only insulin but also IGF-2 [1-4], a mitogenic and anti-apoptotic hormone produced in adult life by stromal cells and by epithelial cancer cells. Moreover, the two IR isoforms bind with different affinity insulin analogs, and activate somewhat differently signaling pathways [8-11]. We also observed that IR-A activates different effectors depending on the stimulating ligand (insulin or IGF-2) [1]. When stimulated by IGF-2, IR-A activates proliferation and inhibits cell apoptotis via pathways that are similar to those activated via the IGF-1R [2-4]. Moreover, in the mouse embryo cells with a targeted disruption of the IGF-1R gene, IR-A but not IR-B, induces IRS-1 nuclear translocation [12].
In order to further investigate the role of the two IR isoforms in cell differentiation we now used a peculiar cell model already studied for investigating the differentiation process [13-15]. 32D cells are murine hemopoietic cells with an absolute requirement for Interleukin-3 (IL-3), showing massive apoptosis upon IL-3 withdrawal [16,17]. Parental 32D cells express low levels of both insulin and IGF-1 receptors, and do not express the Insulin Receptor Substrates (IRSs) [13,18], a family of proteins downstream of the IR that are phosphorylated in response to insulin but also to IGF-1, IGF-2 and other hormones and cytokines. The 32D cell model has been used in the past to investigate the specific IGF-1 and insulin signaling effects via IRSs.
IR overexpression in engineered 32D parental cells has little or no effect on 32D cell survival after IL-3 withdrawal [18,19] but survival can be obtained by the simultaneous expression of ectopic IRS-1 and IR [18,19]. This effect is present both in cells expressing IR-A or IR-B [20]. In contrast, when IRS-1 is absent differentiation is activated by insulin but only in 32D/IR-B and not in 32D/IR-A cells. Even in the 32D/IR-B cells, however, differentiation cannot be completed because cells do not survive long enough without IL-3 [20].
To better investigate the process of cell differentiation and the signaling pathways involved by the two IR isoforms we used IRS-3, an additional and less studied component of the IRS family, that is maximally expressed during the early phases of embryonic development [21] and is believed to play a major role in the differentiation process [22]. IRS-3 is prevalently expressed in liver and fat of rodents [23] while in humans it is believed to be less essential than IRS-1 and IRS-2. Its loss, therefore, is tolerated for cell growth or differentiation [23,24].
We used IRS-3 to study the role of IR isoforms in cell differentiation, because this molecule is a major mediator of cell differentiation in mice [22].
We engineered 32D cells to express only IR-A or IR-B with IRS-3 and stimulated with either insulin or IGF-2. In these cell models we evaluated: 1) cell survival and growth after IL-3 withdrawal; 2) cell differentiation; 3) intracellular signaling pathways involved in cell proliferation and differentiation.
Materials and Methods
Plasmids
Hemagglutinin tagged IRS-3 (pHA-IRS-3) was generated from pcDNA3HA in which mouse IRS-3 was cloned in BamHI and EcoRI containing the neomycin gene resistance.
The pNTK2 expression vectors containing the cDNA for either IR-A (Ex11-) or IR-B (Ex11+) were kindly provided by Dr. Axel Ullrich (Munich, Germany) [1].
Antibodies
The following antibodies were purchased b subunit, polyclonal anti-IRS-3 antibody, polyclonal anti-HA, monoclonal anti Shc. The following antibodies were purchased by Cell Signaling Technology (Beverly, MA, USA): monoclonal anti-PY, monoclonal anti-HA, polyclonal anti-ERK, polyclonal anti-phospho-ERK, polyclonal anti-p70S6K, polyclonal anti-pospho-p70S6K. Polyclonal anti Shc was purchased by BD Biosciences (San Jose, CA, USA).
Cell lines
32D murine hematopoietic cell line clone 3 was stably transfected with a plasmid expressing the mouse cDNA for IRS-3. 32D/IRS-3 cells were subsequently stably co-transfected with either human IR-A or human IR-B and a plasmid carrying puromycin resistance. All these cell lines were mixed populations. Cells were grown in RPMI 1640 medium supplemented with 10% heat-inactivated fetal bovine serum (Thermo Fisher Scientific, Waltham, MA, USA), 10% conditioned medium from WEHI (mouse myelomonocytic cells) as a source of IL-3, 2 mM L-glutamine (Sigma-Aldrich Co., Saint Louis, Missouri, USA), and the required antibiotic to maintain the selective pressure (600 µg/ml G418 for 32D/IRS-3, 600 µg/ml G418 plus 0.3 µg/ml puromycin for 32D/IRS-3/IR-A and 32D/IRS-3/IR-B cells). For brevity, the WEHI cell-conditioned medium will be referred to as IL-3.
Transfection
Cells were transfected by electroporation. Briefly, 10x106 cells were suspended in electroporation buffer, a mixture of HEPES 20 mM, NaCl 137 mM, KCl 5 mM, Na2HPO4 0.7 mM, D-glucose 6 mM, buffered to pH 7.0. The plasmids containing the IR-A or IR-B cDNA (20 mg of DNA) were mixed with the cell suspension and placed in a 4 mm-gap electroporation cuvette (Bio-Rad, Hercules, CA, USA). Cells were electroporated at a fixed capacitance of 960 mF and 0.32 kV using a Bio-Rad Gene Pulser instrument. The electroporated cells were transferred to 75 cm2 flask containing complete medium and placed in the incubator. The medium was replenished after 24 h. The antibiotic selection was added after 48 h.
mRNA isolation and reverse transcription-PCR for IR isoform measurement
mRNA was extracted from cells with Trizol RNA isolation reagent (Thermo Fisher Scientific). Total RNA (5 mg) was reverse transcribed into cDNA using a thermoScript RT-PCR Kit (Thermo Fisher Scientific). Synthesised cDNA was then combined in a PCR reaction using forward and reverse primers as previously described [8].
Cell number and viability
Exponentially growing cells were washed 3 times with PBS and seeded 5x10⁴/ml in IL-3 free medium (RPMI-1640 medium containing 10% heat- inactivated FBS) supplemented with 10 nM Insulin (Sigma-Aldrich Co) or 10 nM IGF-2 (Merck Millipore, Billerica, MA, USA) at the indicated times. To evaluate the effect on cell growth of either PD98059, a ERK pathway inhibitor (Merck Millipore), or LY294002, a PI3K pathway inhibitor (Merck Millipore), exponentially growing cells were treated at the indicated times with 10 nM insulin and either 50 µM of the ERK inhibitor or 20 µM of the PI3K inhibitor. At each time point, viable cells were counted by trypan blue exclusion [19,25].
Differentiation studies
Exponentially growing cells were washed 3 times with PBS and seeded 5x10⁴/ml in IL-3 free medium supplemented with 10 nM of either Insulin or IGF-2 for 24 h. ERK or PI3K pathway inhibition studies were carried out as indicated above. To evaluate the degree of granulocytic differentiation, cytospins were stained with Wright-Giemsa. Polymorphonuclear cells and/or granulations in the cytoplasm were considered markers of differentiated cells [13,14].
IR and signaling pathway studies
Exponentially growing cells were washed with PBS to remove IL-3 and were incubated in serum-free medium supplemented with 0.1% bovine serum albumin for 16-18 h before stimulation with 10 nM of either insulin or IGF-2. Cells were lysed with lysis buffer (50 mM HEPES pH 7.5, 150 mM NaCl, 1.5 mM MgC12, 1 mM EGTA, 10% Glycerol, 1% Triton-X-100, 100 mM NaF, 10 mM Na-Pyrophosphate, 0.5 mM Na-orthovanadate, 0.5 mM PMSF, protease inhibitors). Cell lysates were resolved directly (50 mg of proteins) or after immunoprecipitation with specific antibodies by SDS-polyacrylamide gel electrophoresis and transferred to a nitrocellulose filter. To measure insulin receptor phosphorylation cells were lysed with 50 mM Tris Hcl pH7.4, 150 mM NaCl, 5 mM EDTA, 1% NP-40, 0.1% Triton-X-100, 0.5 mM Na-orthovanadate, 0.5 mM PMSF, protease inhibitors (Roche Diagnostics, Mannheim, Germany), immunoprecipitated with the anti-IR b-subunit polyclonal antibody and blotted with an anti-PY monoclonal antibody. To evaluate IRS-3 content in transfected cells, 500 µg of proteins were immunoprecipitated with an anti-HA monoclonal antibody and blotted with an anti-HA polyclonal antibody. IRS-3 phosphorylation was measured in cell lysates immunoprecipitated with an anti-IRS-3 polyclonal antibody and blotted with an anti-PY antibody, while Shc phosphorylation was measured in cell lysates immunoprecipitated with a Shc polyclonal antibody and blotted with an anti-PY. ERK1/2 and p70S6K phosphorylation was evaluated in cell lysates transferred to a nitrocellulose filter and blotted with specific antibodies. Western blotting was carried out by standard techniques [3,4].
Results
Cell models
Mixed populations of cells expressing mouse IRS-3 tagged with Hemagglutinin (HA) (32D/IRS-3 cells) were generated from parental 32D cells. From these cells we obtained two additional mixed cell population expressing at a similar level either the A or the B isoform of the IR (32D/IRS-3/IR-A and 32D/IRS-3/IR-B, respectively) (Figure 1).
To note that, at variance with the same parental cells (32D/IRS-3), IRS-3 is more expressed in cells expressing also the IR isoforms (Figure 1A). Since a similar phenomenon also occurs in 32D cells transfected with IRS-1 when IGF-1R is co-transfected [13], this may be the consequence of a stabilizing effect of the co-expression of tyrosine kinase receptors (like IR or IGF-1R) on IRS proteins.
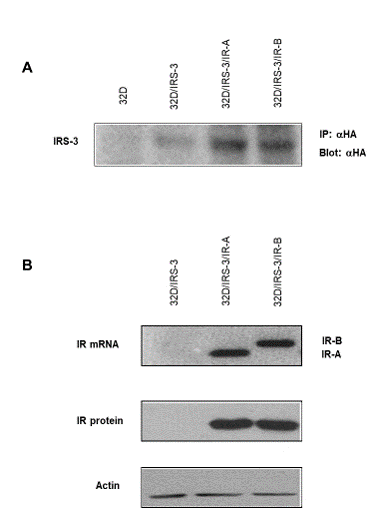
Figure 1: IRS-3 and IR isoform expression in 32D-derived cells. A) IRS-3 expression: Lysates of cells expressing HA-tagged-IRS-3 were immunoprecipitated with a monoclonal anti-HA antibody and then blotted with a polyclonal anti-HA antibody; B) IR isoform expression (mRNA and protein): 32D/IRS-3 cells were transfected with plasmids containing either IR-A or IR-B isoform cDNA, to generate mixed populations overexpressing only one insulin receptor isoform. Protein content in each lane was evaluated with an anti-actin antibody. Blots are representative of three separate experiments. |
32D cells grew well in serum supplemented with IL-3 and promptly died in IL-3 deprived serum [19]. Cell death occurred rapidly: by 24 h most cells did not survive, even when expressing IR-A or IR-B and with insulin or IGF-2 added in the medium [20].
Also, 32D/IRS-3 cells grew in serum supplemented with IL-3 and died in IL-3 deprived serum, like parental 32D cells (Figure 2A). In the absence of IL-3 also 32D/IRS-3 cells died even when the medium was supplemented with 10 nM of either insulin or IGF-2 (Figure 2A).
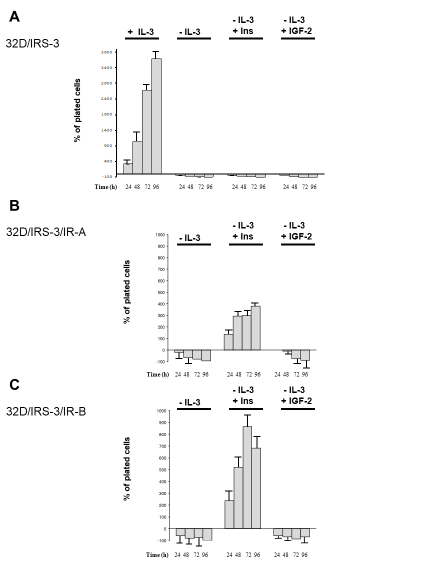
Figure 2: 32D-derived cell number measured 24, 48, 72 and 96 h after IL-3 withdrawal in the presence of either insulin or IGF-2 (both a 10 nM). Results are expressed as percent increase (or decrease) over the number of plated cells and indicate the mean value of four separate experiments. 32D/IRS-3, 32D/IRS-3/IR-A and 32D/IRS-3/IR-B cells are shown in panels A, B and C, respectively. |
To study cell differentiation: cells growing in the presence of IL-3 were used as negative control (undifferentiated) and cells stimulated with G-CSF 10 µg/ml were used as positive control (differentiated) (Figure 3). Cells expressing only IRS-3 (32D/IRS-3) differentiated 24 h after replacing IL-3 with G-CSF (Figure 3), but, as expected, did not differentiate in the presence of insulin or IGF-2 in the lack of the relative receptors (Figure 3).
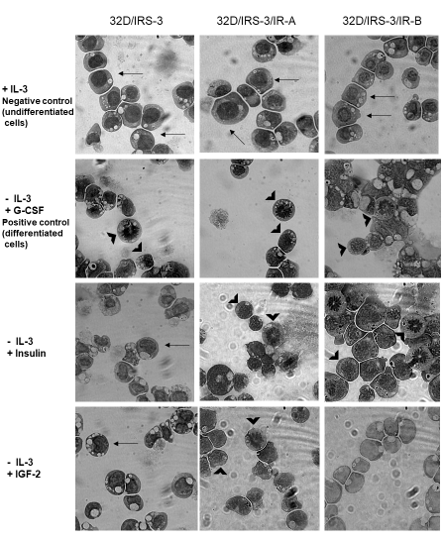
Figure 3: 32D/IRS-3 cell differentiation in the presence of either IR-A or IR-B. Undifferentiated cells have a large, homogeneous nucleus and a thin cytoplasm (see arrows) while differentiated cells have a small nucleus with granules (see arrowheads). In the presence of IL-3 all 32D-derived cells grew well and did not differentiate (Top row). G-CSF (10 µg/ml) caused rapid differentiation (24 h) in all 32D-derived cells (2nd row). Exposure to insulin (10 nM) for 24 h in the absence of IL-3, induced differentiation in 32D/IRS-3/IR-A and 32D/IRS-3/IR-B cells, but not in cells lacking the IR (3rd row). Exposure to IGF-2 (10 nM) in the absence of IL-3, caused differentiation only in 32D/IRS-3/IR-A cells, but not in 32D/IRS-3/IR-B and 32D/IRS-3 cells (Bottom row). |
Cells expressing insulin receptor isoform A
In 32D cells expressing IRS-3 and IR-A, insulin stimulated growth, in spite of IL-3 deprivation (Figure 2B). This effect, however, was not observed when insulin was substituted with IGF-2. In the presence of IGF-2 the cell number was similar to that plated up to 24h and then decreased (Figure 2B). These results were unexpected since IGF-2 binds with high affinity and activates IR-A. Therefore, at variance with insulin, IGF-2 is unable to protect 32D/IRS-3/IR-A cells from apoptosis induced by IL-3 withdrawal.
In 32D/IRS-3/IR-A cells IL-3 replacement with 10 nM b-subunit of IR-A isoform (Figure 4, panel A) indicating that the signaling pathways stretch apart at post-receptor level.insulin induced also differentiation (Figure 3, Insulin). IL-3 replacement with IGF-2 (10 nM) had less effect than insulin on differentiation: 32D/IRS-3/IR-A cells survived for 24 h, but did not grow and only few of them differentiated (Figure 3, IGF-2). The different effects of insulin or IGF-2 occurred in spite of the fact that both ligands induced a marked phosphorylation of the
|
Figure 4: Ligand-dependent (insulin or IGF-2 at 10 nM) IR, IRS-3 and Shc phosphorylation in 32D/IRS-3/IR-A and in 32D/IRS-3/IR-B cells. Phosphorylation was measured 5 min after stimulation, b-subunit, B) IRS-3 and C) Shc.in: A) IR On the right: histograms representing the mean ±SD of the densitometric analysis of three individual experiments after normalization of each phosphoprotein with correspondent total protein. On the left: blots of one representative experiment. |
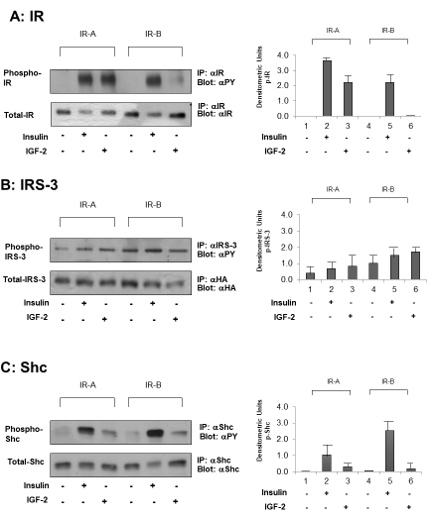
In these cells, under basal conditions IRS-3 was slightly tyrosine phosphorylated (Figure 4, lanes 1 and 4 panel B). When insulin or IGF-2 were added (10 nM, 5 min) a minimal, not significant, increase of IRS-3 phosphorylation was observed (Figure 4, panel B, lines 2 and 3). On the contrary, insulin caused a stronger phosphorylation of Shc, while the effect of IGF-2 was minor (Figure 4, panel C).
Downstream these effectors, in 32D/IRS-3/IR-A cells insulin stimulated ERK1/2 phosphorylation with a peak at 5 min and a short lasting effect (no longer detectable at 15 min) (Figure 5A), while IGF-2 had no effect (Figure 5A). Since ERK1/2 activation is a mayor mitogenic signal, these observations explain the different effect of insulin or IGF-2 on 32D/IRS-3/IR-A growth (Figure 2B).
|
Figure 5: Time-course of ERK1/2 and p70S6 kinase phosphorylation in 32D/IRS-3/IR-A and in 32D/IRS-3/IR-B cells. After16-18 h incubation in serum free medium cells were exposed to either insulin or IGF-2 (10 nM) for the indicated times. Protein content was measured in the same blots after membrane stripping. Blots are representative of three separate experiments. |
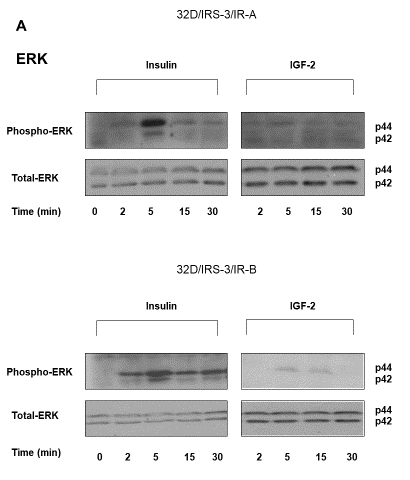
In 32D/IRS-3/IR-A cells insulin stimulated p70S6 kinase phosphorylation with a peak at 5 min and then a slow decline (Figure 5B). A similar time course response was observed after IGF-2 but the effect was very small (Figure 5B).
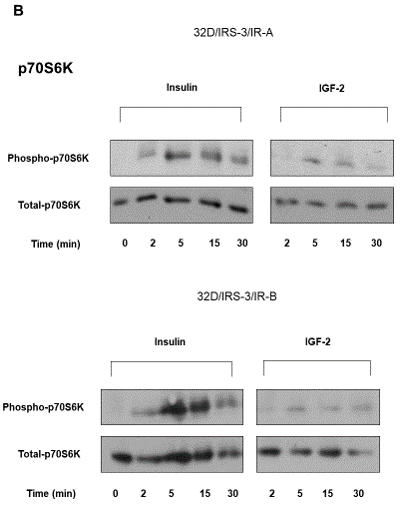
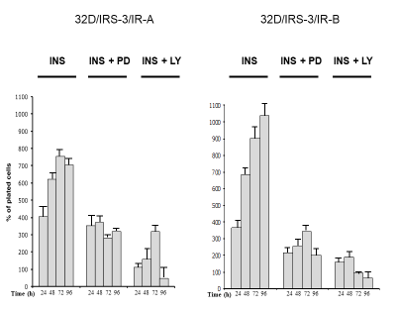
In order to better understand the role of the post-receptor pathways for growth stimulation in 32D/IRS-3/IR-A cells, we measured the changes of cell number in the presence or the absence of the ERK inhibitor PD98056. Only insulin was tested since IGF-2 does not induce growth in these cells (Figure 2B). ERK inhibition decreased insulin effect on cell proliferation (Figure 6) and an even more marked inhibition of insulin-stimulated cell proliferation was observed when the PI3K pathway was inhibited with LY294002 (Figure 6). At variance with growth, the differentiation effect of insulin required the inhibition of both the ERK and the PI3K pathways since it was not inhibited when only PD98059 or LY294002 was added (Figure 7A). Inhibitors were not evaluated in the presence of IGF-2 since its effect on cell differentiation was negligible (Figure 3).
|
Figure 6: Effect of inhibition of either ERK or PI3K on insulin stimulated proliferation of 32D-derived cells. In 32D/IRS-3/IR-A and 32D/IRS-3/IR-B cells the number of cells was measured 24, 48, 72 and 96 h after IL-3 withdrawal and supplementation with either10 nM insulin alone or with the addition of either PD98059 (PD, 50 µM) or LY294002 (LY, 20 µM). Results are expressed as percent increase (or decrease) over the number of cells plated, mean value of four separate experiments. |
|
Figure 7: Effect of either ERK or PI3K inhibition on insulin stimulated differentiation of 32D-derived cells. Cell differentiation was evaluated 24 h after IL-3 withdrawal and supplementation with 10 nM of either insulin or IGF-2 in the presence or absence of either PD98059 (PD, 50 µM) or LY294002 (LY, 20 µM). A) 32D/IRS-3/IR-A cells, B) 32D/IRS-3/IR-B cells. Figure 7 is representative of three separate experiments. |
Cells expressing insulin receptor isoform B
In 32D cells expressing IRS-3 and IR-B, results of insulin stimulation were partially different than in 32D/IRS-3/IR-A cells. IL-3 replacement with 10 nM insulin strongly stimulated growth, with a maximum effect after 72 h which was more than doubled in respect to 32D/IRS-3/IR-A cells (Figure 2C). In IR-B expressing cells insulin also induced cell differentiation, again much more pronounced than in IR-A expressing cells (Figure 3, Insulin). IGF-2, as expected, had no effect in these cells for both cell growth and differentiation (Figure 2C and 3, IGF-2) since IGF-2 has low affinity for IR-B as confirmed by the lack of IR-B phosphorylation (Figure 4, panel A, lines 5 and 6). Also in these cells IRS-3 was tyrosine phosphorylated under basal conditions and both insulin and IGF-2 induce a small, not significant, IRS-3 phosphorylation (Figure 4, panel B). As observed in 32D/IRS-3/IR-A cells, also in cells expressing IR-B insulin caused phosphorylation of Shc much higher than IRS-3 phosphorylation and higher that observed in IR-A expressing cells (Figure 4, panel C, lines 5 and 2). IGF-2 had no effect.
In 32D/IRS-3/IR-B expressing cells insulin stimulated ERK1/2 phosphorylation with an effect that was much more prolonged than in 32D/IRS-3/IR-A cells (still present at 30 min) (Figure 5A). IGF-2 effect on ERK1/2 phosphorylation was minimal and not significant (Figure 5A).
In 32D/IRS-3/IR-B cells p70S6 kinase phosphorylation was markedly stimulated by insulin at 5 and 15 min and the effect persisted at 30 min with values much higher than in 32D/IRS-3/IR-A cells (Figure 5B). IGF-2 effect was insignificant (Figure 5B).
In cells expressing the IR-B isoform, cell proliferation was markedly decreased (more than in IR-A expressing cells) by the inhibition of either the ERK or the PI3K pathway. Insulin-dependent cell growth was more inhibited by the use of the PI3K inhibitor LY294002 (Figure 6). As in 32D/IRS-3/IR-A cells, also 32D/IRS-3/IR-B cell differentiation was not abrogated by either only PD98059 or only LY294002 (Figure 7B).
Discussion
The insulin/IGF-1 system plays a pivotal role in many biological events including cell metabolism, growth, differentiation and cancer [26,27]. The resulting biological effect of this system activation is finely modulated by the interplay between its different components.
In the present study we investigated the biological effects of human IR-A or IR-B when stimulated with either insulin or IGF-2 on 32D cells, a murine hemopoietic cell line that expresses only very low endogenous levels of (murine) IR and the cognate IGF-1 receptors and does not express the IRS proteins. We already reported that in engineered 32D cells the predominant effect of insulin is on cell differentiation when 32D cells express only IR-B (without IRS-1), whereas when IR-A (together with IRS-1) is expressed the major insulin effect is on cell proliferation [20].
We now investigated the role of IRS-3, another member of the IRS proteins family, on the effect of IR isoforms since its involvement in IR signaling is poorly understood [28-31].
Although there are structural similarities between IRS proteins, knockout mouse studies indicated that IRS have different functions in development and metabolism, with IRS-1 mainly involved in growth effects [32-36]. The pleckstrin homology domains of IRS-1, IRS-2 and IRS-3 bind with different specificity to the 3-phosphorylated phosphoinositides, and their localization is different in IRS-1 and IRS-2 in respect to IRS-3 [37]. IRS-3 is able to mediate phosphatidylinositol-3-kinase-dependent metabolic actions of insulin in adipose tissues [38] but, when introduced in IRS-1-deficient brown adipocytes, it is able to restore the PI3K/AKT pathway but not MAPK activation and consequent mitogenesis [39]. Although IRS-3 is not expressed in humans, it is believed to play a role in cell differentiation [22] and protection from apoptosis [40,41]. We transfected IRS-3 in 32D cells in order to investigate the effects and mechanisms of IR isoforms in this cell line growth and differentiation.
The results obtained in the present study may be summarized as follows (Table 1):
- Via IRS-3 both IR isoforms, when activated by insulin, are able to stimulate 32D cell growth in the absence of IL-3, which is an absolute requirement for this cell line survival and proliferation. IR-B is more effective than IR-A, although IR-A is known to have an increased mitogenic activity.
- IGF-2 is not able to replicate the effect of insulin on 32D/IRS-3/IR-A cell growth. While this result is expected for 32D/IRS-3/IR-B cells due to the low affinity of IGF-2 for IR-B, it is unexpected for 32D/IRS-3/IR-A cells.
- Both IR isoforms, when activated by ligands, stimulate 32D/IRS-3 cell differentiation in the absence of IL-3. For this effect IR-B is much more effective than IR-A. In 32D/IRS-3/IR-A cells IGF-2 has a limited effect on cell differentiation, although this action is not fully evaluable due to the short cell survival in the absence of IL-3.
- The post-receptor signaling molecules IRS-3 and Shc are both phosphorylated after insulin binding to both IR isoforms, with IR-B always more effective than IR-A, and Shc markedly more activated than IRS-3.
- Also, intracellular pathways, represented by ERK and p70S6K, are stronger and more prolonged activated after insulin binds to IR-B than to IR-A. IGF-2 is without effect on the ERK pathway even in 32D/IRS-3/IR-A cells and this can explain why it does not stimulate growth in these cells.
- Studies with inhibitors of the PI3K and ERK suggest that both the PI3K and the MAPK pathways must be activated in order to have the IR/IRS-3 stimulated effect on engineered 32D cell growth, while only either one pathway alone is sufficient to elicit the effect on cell differentiation.
|
||||||||||||||||||||||||||||
Taken together these results suggest that IRS-3 can transduce the proliferation effect of insulin via both IR isoforms but IR-B is much more effective. This growth effect requires both the ERK and the PI3K pathways to be activated. The IR-A isoform, although is equally phosphorylated as IR-B by insulin or IGF-2, is unable to transfer the signal via IRS-3 to the ERK pathway and, therefore, in this cell type IGF-2 does not promote cell growth. Data also indicate that in this cell type both IR-A and IR-B can transduce the insulin differentiation signal via IRS-3. Again, this effect is much more marked when IR-B is activated. Moreover, the differentiation program seems to require only the activation of only one intracellular pathway since this effect is not abrogated by the inhibition of either the ERK or the PI3K pathway.
In conclusion these studies indicate that, in the model studied, IR-B when stimulated by insulin, is much more effective than IR-A for stimulating mitogenic and differentiation pathways via IRS-3.
References
- Tseng YH, Ueki K, Kriauciunas KM, Kahn CR (2002) Differential roles of insulin receptor substrates in the anti-apoptotic function of insulin-like growth factor-1 and insulin. J Biol Chem 277: 31601-31611.
- Kaburagi Y, Satoh S, Yamamoto-Honda R, Ito Y, Akanuma Y, et al. (2003) Protection of insulin receptor substrate-3 from staurosporine-induced apoptosis. Biochem Biophys Res Commun 300: 371-377.
- Arribas M, Valverde AM, Benito M (2003) Role of IRS-3 in the insulin signaling of IRS-1-deficient brown adipocytes. The Journal of biological chemistry 278: 45189-45199.
- Zhou L, Chen H, Xu P, Cong LN, Sciacchitano S, et al. (1999) Action of Insulin Receptor Substrate-3 (IRS-3) and IRS-4 to stimulate translocation of GLUT4 in rat adipose cells. Mol Endocrinol 13: 505-514.
- Razzini G, Ingrosso A, Brancaccio A, Sciacchitano S, Esposito DL, et al. (2000) Different subcellular localization and phosphoinositides binding of insulin receptor substrate protein pleckstrin homology domains. Mol Endocrinol 14: 823-836.
- Fantin VR, Wang Q, Lienhard GE, Keller SR (2000) Mice lacking insulin receptor substrate 4 exhibit mild defects in growth, reproduction, and glucose homeostasis. Am J Physiol Endocrinol Metab 278: 127-133.
- Liu SC, Wang Q, Lienhard GE, Keller SR (1999) Insulin receptor substrate 3 is not essential for growth or glucose homeostasis. J Biol Chem 274: 18093-18099.
- Withers DJ, Gutierrez JS, Towery H, Burks DJ, Ren JM, et al. (1998) Disruption of IRS-2 causes type 2 diabetes in mice. Nature 391: 900-904.
- Araki E, Lipes MA, Patti ME, Brüning JC, Haag B, et al. (1994) Alternative pathway of insulin signalling in mice with targeted disruption of the IRS-1 gene. Nature 372: 186-190.
- Tamemoto H, Kadowaki T, Tobe K, Yagi T, Sakura H, et al. (1994) Insulin resistance and growth retardation in mice lacking insulin receptor substrate-1. Nature 372: 182-186.
- Kaburagi Y, Yamauchi T, Yamamoto-Honda R, Ueki K, Tobe K, et al. (1999) The mechanism of insulin-induced signal transduction mediated by the insulin receptor substrate family. Endocr J 46: 25-34.
- Villar M, Serrano R, Gallardo N, Carrascosa JM, Martinez C, et al. (2006) Altered subcellular distribution of IRS-1 and IRS-3 is associated with defective Akt activation and GLUT4 translocation in insulin-resistant old rat adipocytes. Biochim Biophys Acta 1763: 197-206.
- Escribano O, Arribas M, Valverde AM, Benito M (2007) IRS-3 mediates insulin-induced glucose uptake in differentiated IRS-2(-/-) brown adipocytes. Mol Cell Endocrinol 268: 1-9.
- Giovannone B, Scaldaferri ML, Federici M, Porzio O, Lauro D, et al. (2000) Insulin Receptor Substrate (IRS) transduction system: distinct and overlapping signaling potential. Diabetes Metab Res Rev 16: 434-441.
- Vigneri PG, Tirro E, Pennisi MS, Massimino M, Stella S, et al. (2015) The Insulin/IGF System in Colorectal Cancer Development and Resistance to Therapy. Front Oncol 5: 230.
- Belfiore A, Malaguarnera R, Vella V, Lawrence MC, Sciacca L, et al. (2017) Insulin Receptor Isoforms in Physiology and Disease: An Updated View. Endocr Rev 38: 379-431.
- Navarro M, Valentinis B, Belletti B, Romano G, Reiss K, et al. (2001) Regulation of Id2 gene expression by the type 1 IGF receptor and the insulin receptor substrate-1. Endocrinology 142: 5149-5157.
- Al-Salam A, Irwin DM (2017) Evolution of the vertebrate insulin receptor substrate (Irs) gene family. BMC Evol Biol 17: 148.
- Björnholm M, He AR, Attersand A, Lake S, Liu SC, et al. (2002) Absence of functional insulin receptor substrate-3 (IRS-3) gene in humans. Diabetologia 45: 1697-1702.
- Tseng YH, Kriauciunas KM, Kokkotou E, Kahn CR (2004) Differential roles of insulin receptor substrates in brown adipocyte differentiation. Mol Cell Biol 24: 1918-1929.
- Sciacchitano S, Taylor SI (1997) Cloning, tissue expression, and chromosomal localization of the mouse IRS-3 gene. Endocrinology 138: 4931-4940.
- Sciacca L, Prisco M, Wu A, Belfiore A, Vigneri R, et al. (2003) Signaling differences from the A and B isoforms of the insulin receptor (IR) in 32D cells in the presence or absence of IR substrate-1. Endocrinology 144: 2650-2658.
- Peruzzi F, Prisco M, Dews M, Salomoni P, Grassilli E, et al. (1999) Multiple signaling pathways of the insulin-like growth factor 1 receptor in protection from apoptosis. Mol Cell Biol 19: 7203-7215.
- Wang LM, Myers MG, Sun XJ, Aaronson SA, White M, et al. (1993) IRS-1: essential for insulin- and IL-4-stimulated mitogenesis in hematopoietic cells. Science 261: 1591-1594.
- Askew DS, Ashmun RA, Simmons BC, Cleveland JL (1991) Constitutive c-myc expression in an IL-3-dependent myeloid cell line suppresses cell cycle arrest and accelerates apoptosis. Oncogene 6: 1915-1922.
- Valtieri M, Tweardy DJ, Caracciolo D, Johnson K, Mavilio F, et al. (1987) Cytokine-dependent granulocytic differentiation. Regulation of proliferative and differentiative responses in a murine progenitor cell line. J Immunol 138: 3829-3835.
- Sun H, Baserga R (2004) Deletion of the pleckstrin and phosphotyrosine binding domains of insulin receptor substrate-2 does not impair its ability to regulate cell proliferation in myeloid cells. Endocrinology 145: 5332-5343.
- Valentinis B, Navarro M, Zanocco-Marani T, Edmonds P, McCormick J, et al. (2000) Insulin receptor substrate-1, p70S6K, and cell size in transformation and differentiation of hemopoietic cells. J Biol Chem 275: 25451-25459.
- Valentinis B, Romano G, Peruzzi F, Morrione A, Prisco M, et al. (1999) Growth and differentiation signals by the insulin-like growth factor 1 receptor in hemopoietic cells are mediated through different pathways. J Biol Chem 274: 12423-12430.
- Wu A, Sciacca L, Baserga R (2003) Nuclear translocation of insulin receptor substrate-1 by the insulin receptor in mouse embryo fibroblasts. J Cell Physiol 195: 453-460.
- Li Calzi S, Choice CV, Najjar SM (1997) Differential effect of pp120 on insulin endocytosis by two variant insulin receptor isoforms. Am J Physiol 273: 801-808.
- Leibiger B, Leibiger IB, Moede T, Kemper S, Kulkarni RN, et al. (2001) Selective insulin signaling through A and B insulin receptors regulates transcription of insulin and glucokinase genes in pancreatic beta cells. Mol Cell 7: 559-570.
- Vigneri R, Squatrito S, Sciacca L (2010) Insulin and its analogs: actions via insulin and IGF receptors. Acta Diabetol 47: 271-278.
- Sciacca L, Cassarino MF, Genua M, Pandini G, Le Moli R, et al. (2010) Insulin analogues differently activate insulin receptor isoforms and post-receptor signalling. Diabetologia 53: 1743-1753.
- Avnet S, Perut F, Salerno M, Sciacca L, Baldini N (2012) Insulin receptor isoforms are differently expressed during human osteoblastogenesis. Differentiation; Research in biological diversity 83: 242-248.
- Savkur RS, Philips AV, Cooper TA (2001) Aberrant regulation of insulin receptor alternative splicing is associated with insulin resistance in myotonic dystrophy. Nat Genet 29: 40-47.
- Kalli KR, Falowo OI, Bale LK, Zschunke MA, Roche PC, et al. (2002) Functional insulin receptors on human epithelial ovarian carcinoma cells: implications for IGF-II mitogenic signaling. Endocrinology 143: 3259-3267.
- Sciacca L, Mineo R, Pandini G, Murabito A, Vigneri R, et al. (2002) In IGF-I receptor-deficient leiomyosarcoma cells autocrine IGF-II induces cell invasion and protection from apoptosis via the insulin receptor isoform A. Oncogene 21: 8240-8250.
- Vella V, Pandini G, Sciacca L, Mineo R, Vigneri R, et al. (2002) A novel autocrine loop involving IGF-II and the insulin receptor isoform-A stimulates growth of thyroid cancer. J Clin Endocrinol Metab 87: 245-254.
- Sciacca L, Costantino A, Pandini G, Mineo R, Frasca F, et al. (1999) Insulin receptor activation by IGF-II in breast cancers: evidence for a new autocrine/paracrine mechanism. Oncogene 18: 2471-2479.
- Frasca F, Pandini G, Scalia P, Sciacca L, Mineo R, et al. (1999) Insulin receptor isoform A, a newly recognized, high-affinity insulin-like growth factor II receptor in fetal and cancer cells. Mol Cell Biol 19: 3278-3288.