 LOGIN
LOGIN REGISTER
.png)

Research Article
Carbon and nitrogen distribution in some carp polyculture ponds of Andhra Pradesh, India
Subhendu Adhikari1*,Subhas Sarkar2, P P Chakrabarti1, B S Giri3, Bindu R Pillai2 and J K Sundaray2
1 Regional Research Centre (RRC) of ICAR-Central Institute of Freshwater Aquaculture, Rahara, Kolkata, West Bengal, India
2ICAR-Central Institute of Freshwater Aquaculture, Kausalyaganga, Bhubaneswar, India
3 Regional Research Centre (RRC) of ICAR-CIFA, Penamaluru Fish Seed Farm, Penamaluru, Vijayawada, India
*Corresponding Author: Subhendu Adhikari, Regional Research Centre (RRC) of ICAR-Central Institute of Freshwater Aquaculture, Rahara, Kolkata, West Bengal, India; E-mail: subhendu66@rediffmail.com
Citation: Adhikari S, Sarkar S, Chakrabarti PP, Giri BS, Pillai BR et al. (2018) Carbon and nitrogen distribution in some carp polyculture ponds of Andhra Pradesh, India. J Aquat Res Mar Sci 2018: 91-96. doi:https://doi.org/10.29199/ARMS.201024
Received Date: 20 October, 2018, 2018; Accepted Date:19 December, 2018; Published Date:28 December, 2018
Abstract:
The excessive and indiscriminate uses of carbon (C) and nitrogen (N) through feed, fertilizers and manures in aquaculture ponds could play a vital role in the emission of greenhouse gases such as carbon dioxide (CO2), methane (CH4), and nitrous oxide (N2O). Therefore, it is important to know about the distributions of N and C in the aquaculture ponds so that management strategies could be made for the minimum emissions and loss of these two nutrients in the fish ponds. The present investigation was thus undertaken for studying C and N balances in seven Indian major carp’s polyculture ponds in Andhra Pradesh, India. The study revealed that overall, 8 % of carbon inputs from different sources was recovered in harvested fish, 61 % accumulated in the sediment and 0.5 % was discharged at harvested time during 165 days of culture period. About 16 % of nitrogen inputs from different sources was retained in harvested fish, 70 % accumulated in the sediment and 2 % was discharged at harvest time during 165 days of culture period. The results also showed that to produce 1 kg of fresh fish, 0.88±0.21 kg feed C and 0.08±0.01 kg feed N were fed, while to gain 1 kg C and 1 kg N in fish biomass, 6.56±1.60 kg feed C and 2.47±0.84 kg feed N was fed. Thus, in the present study about 6.5 times more C and about 2.5 times more N were used in the feed as fish feeding during the culture period.
Key words: carbon, nitrogen, balance, Indian major carps
Introduction:
Aquaculture is shaping up into a global venture and it is considered as the fastest growing food producing sector in the world to feed the ever-growing population. Freshwater aquaculture is the principal component for catering the increasing demand for fish in India. With a total fish production of 9.33 million metric tons (mmt) in 2010, India has become the third largest fish producer in the world. Of the total, about 49.72% (4.64 mmt) is contributed by freshwater aquaculture and India is second to China in freshwater aquaculture production. Presently 600 aquatic species are raised in captivity in about 190 countries for production in farming systems of varying input intensities and technological sophistication. Under such circumstances, it is important to use all the inputs for the fish production judiciously with minimum generation of waste and residues in the environment. Otherwise, the unutilized nutrients could emit different greenhouse gases to the environment, which in turn, will act as the agents of global warming.
Carbon (C) is important in aquaculture pond because it is a main source of all organic matter [1]. Organic matter contains about 45 to 50% C [2]. In aquaculture, carbon is also a major concern to environment due to greenhouse gas emissions such as carbon dioxide (CO2), methane (CH4). The excessive accumulation of organic carbon (OC) in the sediment enhances anaerobic process and results the release of toxic metabolic substances within the pond and oxygen depletion [3], causing stress to fish, leading to disease outbreaks or direct mortality and lowering yield per crop. The respiration of aquatic animals and microbial decomposition of organic matter in aquaculture pond can cause carbon emissions to environment and release of greenhouse gases to the atmosphere [3]. Nitrogen (N) is also an important element in aquaculture. Nitrogen (N) is applied in the fish feed as protein and also as inorganic fertilizers to produce phytoplankton. Uses of N as feed or fertilizer is also a concern to environment due to gas emissions such as nitrous oxide (N2O). Thus, it is important to know that the distribution of N and C in the aquaculture ponds so that management strategies could be made for the minimum emissions and loss of these two nutrients in the fish ponds. The present investigation was thus undertaken for studying C and N balances in carp aquaculture ponds in Andhra Pradesh, India.
Materials and Methods
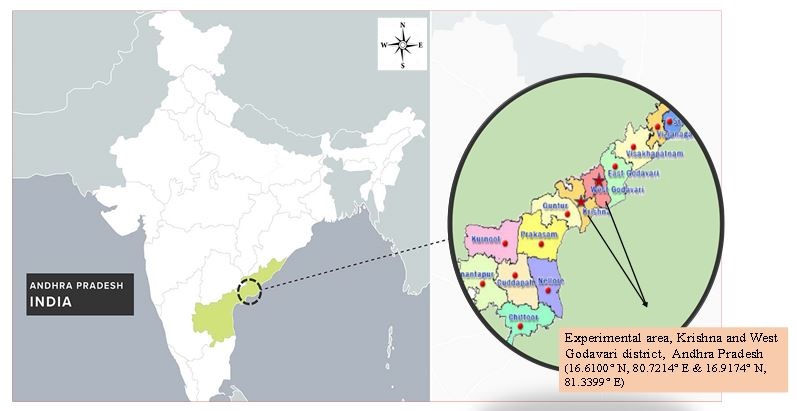
The carbon and nitrogen balance study was conducted in seven intensive carp polyculture ponds in Krishna and West Godavari delta of Andhra Pradesh, India. The selected ponds in this area are shown in the Map.
 |
These ponds were stocked with Labeo rohita (rohu), Catla catla (catla) and Cirrhinus mrigala (mrigal). The culture period was around for 165 days. Among the management practices, cow dung, and inorganic fertilizers [urea, single super phosphate (SSP), and di-ammonium phosphate (DAP)] were used for plankton production and the de-oiled rice bran (DORB), groundnut oil cake (GNOC) were used as fish feed at a 1:1 ratio.
To determine initial and final nutrient levels in water, sample was collected prior to fish stocking and at the time of harvesting. The water samples was also digested with tri-acid and measured for total N and the water samples were refluxed with potassium di-chromate for OC. Six cores sediment samples (up to 15 cm depth) from each pond were collected at the beginning and at the time of harvest before draining. These sediment samples were then mixed into composite one for the analysis. After air drying, these sediment samples were pulverized to pass by 0.25-mm screen and then analyzed for organic carbon (OC) and total N. For the measurements of N and OC from the cow dung, fish feed, and carcasses of harvested fish, they were freeze-dried and pulverized to pass by a 0.85-mm screen. Total N in these samples were measured with per-sulfate oxidation [4] and total OC was determined by the rapid titration method after oxidation using potassium permanganate and concentrated sulfuric acid [5].
The survival rate, mean fresh body weight (MWT), and total production of fish were determined. The MWT was calculated by the total fresh weight at harvest time of ten randomly selected individuals of each species of rohu, catla and mrigal and divided by ten. For each pond, the total weight of carps was calculated.
The input, output, uptake and accumulation of total OC and total N during the culture period was calculated. The inputs of water, fertilizers, and feed and the outputs in drained water, sediment and harvested fish were calculated. The nutrients concentrations in water were multiplied with total water volume to know the input and output in the form of water. The nutrient content in sediment was calculated as follows: nutrient concentration in the sediment x total sediment mass. The total sediment mass was determined from the mean bulk density of the sediment. Nutrient (N/OC) input in feed was calculated as follows: nutrient concentration in feed x total feed applied. Nutrient (N/OC) output through fish was calculated as follows: nutrient concentration in fish carcasses x total fish biomass.
All the data are presented as the mean (average) with standard deviation (SD).
Results and Discussion:
The stocking and harvesting characteristics of the aquaculture ponds are presented in table 1. The pond size varied from 2.8 to 9.6 ha. The stocking size of rohu was 260 ± 125 g while the same for catla was 492 ± 289 g. In two ponds, mrigal was stocked in addition to rohu and catla and the stocking size was 200 g. The overall stocking density was 6000 ± 1471/ha. The initial biomass in these ponds was 1414 ± 734 kg/ha, while the gross production was 6930 ± 1913 kg/ha in 165 days. The net production was 5511 ± 2042 kg/ha/165d. The harvested size of rohu, catla, and mrigal was 1222 ± 301; 2221 ±587 and 1250 ± 353 g, respectively.
Table 1. Stocking and harvesting characteristics of some aquaculture ponds in Andhra Pradesh (R= Labeo rohita, C= Catla catla, M= Cirrhinus mrigala) |
The management practices of the aquaculture ponds have shown in table 2. The fish were fed mainly by de-oiled rice bran and ground nut oil cake. Overall, 15133 ± 5058 kg/ha de-oiled rice bran and 1902 ±672 kg/ha ground nut oil cake
were applied in these fish ponds as feed. In three ponds, cattle dung was applied by 14096 ± 5894 kg/ha during the culture period. The inorganic fertilizers viz., urea, DAP and SSP were applied in these ponds at the initial stages @ 78, 51 and 226 kg/ha, respectively during the culture period.
were applied in these fish ponds as feed. In three ponds, cattle dung was applied by 14096 ± 5894 kg/ha during the culture period. The inorganic fertilizers viz., urea, DAP and SSP were applied in these ponds at the initial stages @ 78, 51 and 226 kg/ha, respectively during the culture period.
Table 2. Management practices in the aquaculture ponds |
The carbon balances and its use efficiency are presented in table 3. On an average, the total carbon input was 11294±2474 kg ha-1165d-1, of which 42 % was feed carbon, cattle dung (manure) contributed for 6 %, initial pond sediment contributed about 50 %, stocked fish contributed for 1.7 % and initial filling the pond plus intake of water provided only 0.3 %. Carbon inputs from rainfall and run-off were assumed to be negligible.
Table 3. Carbon balances (mean ±SD) kg/ha/165d and use efficiency (kg/kg fish produced) of aquaculture ponds of Andhra Pradesh |
||||||||||||||||||||||||||||||||||||||||||||||||
On an average, about 61.5 % of total carbon inputs accumulated in the pond sediments. Only 8.0 % of total carbon input was retained as organic carbon in fish biomass for 165 days period while higher amount of organic carbon (11.5 %) was accumulated in the sediment. Only 0.5 % carbon input was lost through discharge water during dewatering of the pond at harvest time. Overall, total carbon outputs were 70 % of total inputs. The remaining portions of carbon were probably lost through CO2 emission or drainage at harvest time. Carbon lost through evaporation was not considered.
The nitrogen balances and its use efficiency have shown in table 4. Overall, nitrogen in commercial feed, initial sediment, fertilizers and manure were the major sources of total nitrogen input; and nitrogen in accumulated sediment, harvested fish and discharge water at harvest time were the major sinks of total nitrogen outputs. On an average, the total nitrogen input was 1233±145 kg ha-1 165 d-1, of which initial sediment contributed for 57 %, feed contributed about 30.6 %, fertilizers and manure (cow dung) accounted for 5 % and 3.5 %, respectively. Nitrogen in water used for initial filling the pond and stocked fish provided about 0.6 % and 3.3 %, respectively. Nitrogen inputs from rainfall and run-off were assumed to be negligible.
Table 4. Nitrogen balances (mean ±SD) kg/ha/165d and use efficiency (kg/kg fish produced) of aquaculture ponds of Andhra Pradesh |
|||||||||||||||||||||||||||||||||||||||||||||||||||
On an average, about 70 % of total nitrogen input accumulated in the pond sediments, 2 % of nitrogen input was flushed out with the discharge water at the harvest time and 16 % of nitrogen input was retained in fish biomass for 165 days period. Overall, total nitrogen output were 88% of total inputs. The remaining portions of nitrogen were probably lost through nitrogen volatilization or leaching as nitrate during the culture. Nitrogen lost through evaporation was not estimated in the present study.
It has been reported that 30 % of total feed OC and 38 % of total feed N were retained, respectively as fish (salmon) biomass [6]. In the present study, OC and N retention in the Indian major carps were much less (8 % OC and 16 % N) than salmon. A good amount of OC (0.5 %) and N (2.0 %) were lost through the harvested water in the present study. Nutrient losses in ponds at draining time reported to be 7-9 % of total N, and 2-3 % of chemical oxygen demand (COD) [7].
Both OC and N accumulation in the sediment increased during the culture period in the present study. The increased OC and N in the sediment elevated the oxygen demand through aerobic and anaerobic decomposition resulting in oxygen depletion and aerobic top layer reduction in the sediment [8,9]. Moreover, anaerobic activities or condition in the sediment produced toxic substances such as accumulated ammonia, nitrite, hydrogen sulfide, ferrous iron and manganese that are adversely affected to fish growth [9,10]. In semi-intensive fish ponds, 38-46 % OC of total food inputs was reported by different researchers [11,12,7]. About 81 % OC in the sediment was also reported [13] in integrated agriculture-aquaculture systems applying livestock manure or human excreta and crop residues with a high carbohydrate content. In the present study, pelleted feed was not applied, and the de-oiled rice bran and groundnut oil cake were used to feed the fish. These feeds contained about 28-32 % OC, thereby carbon accumulated in the sediment was also higher. In addition, cattle dung was used in three ponds, thus this could also be the reason of higher organic carbon accumulation in the sediment in the present study.
The feed carbon efficiency was 0.88±0.21 kg per kg of fish produced. Overall, 6.56 ± 1.60 kg carbon was fed for each kilogram of carbon retained in fish biomass, indicating that a high amount of carbon was wasted through feeding. This wasted carbon could be emitted into the atmosphere as CO2 and CH4 which in turn, to be the agent of global warming. Overall, the feed nitrogen efficiency was 0.08 kg per kilogram of fish produced. Moreover, to get 1 kg of nitrogen retained in fish biomass, about 2.47 kg nitrogen was to be fed in the culture period. Thus, about 2.5 times more nitrogen was used in the feed. Good quality pelleted feed should be used to reduce the loss of this element in the environment. Otherwise, the N could be emitted into the atmosphere as N2O, which in turn, will be an agent for global warming.
The reduction of waste production from the aquaculture practices can be achieved through nutritional strategies developed by proper nutrients formulation and also by efficient feeding systems based on energy requirements of the species [14]. The reduction in nutrient loads of aquaculture production can be achieved through proper water management strategies [15]. The better use of feed based on proper management can reduce waste production in aquaculture. Adaptation strategies as a mitigation measure of global warming can be suggested through the correct amount of feed use in aquaculture practices to avoid loss of nutrients as well as the quality of feed used for proper assimilation by the fish. Excessive organic carbon and nitrogen accumulated in the sediment required high oxygen demand causing oxygen depletion and formation of reduced substances which could also be toxic to the fish.
Conclusion:
The present study indicated that 16 % N, and 8 % OC of the total inputs were converted into fish flesh of Indian major carps. Almost 70 % N and 61 % OC of the total inputs accumulated in the sediment of the ponds. The present study also showed that to produce 1 kg of fresh fish, 0.88±0.21 kg feed C and 0.08±0.01 kg feed N were fed, while to gain 1 kg C and 1 kg N in fish biomass, 6.56±1.60 kg feed C and 2.47±0.84 kg feed N was fed. Thus, about 6.5 times more C and about 2.5 times more N were used in the feed as fish feeding during the culture period. The drained water at harvested time also contained appreciable amounts of N and OC. The chance of environmental pollution by this nutrient enriched drained water will be reduced as these waters are used to irrigate horticultural crops, particularly in India.
Acknowledgement:
The authors are grateful to the Director of ICAR-Central Institute of Freshwater Aquaculture for providing necessary facilities to carry out the present work. The authors are also grateful to the farmers for their generous help for carrying out the present study in their ponds.
Conflict of Interest and Ethical statement:
We do not have any conflict of interest regarding the present work and also the work has been conducted following the codal formalities of the ethical issues of our institute.
References
- Boyd CE, Tucker CS (1992) Water Quality and Pond Soil Analyses for Aquaculture. Alabama Agricultural Experiment Station, Auburn University. 348pp.
- Boyd CE, Wood CW, Thunjai T (2002) Aquaculture pond bottom soil quality management. Pond Dynamics/Aquaculture collaborative Research Support Program Oregon State University, Corvallis, Oregon 97331-1641, p1-41.
- Bunting SW, Pretty J (2007) Aquaculture Development and Global Carbon Budgets: Emissions, Sequestration and Management Options. Centre for Environment and Society Occasional Paper 2007-1, University of Essex, Colchester UK. P 1-39.
- Raveh R, Avnimelech Y (1979) Total nitrogen analysis in water, soil and plant material with persulphateoxidation. Water Research, 13: 911-912.
- Walkley A, I A Black (1934) An examination of the Degtjareff method for determining soil organic matter, and a proposed modification of the chromic acid titration method. Soil Science, 37: 29-37.
- Wang, X., Olsen, L.M., Reitan, K.I., and Olsen, Y. (2012) Discharge of nutrient wastes from salmon farms: environmental effects, and potential for integrated multi-trophic aquaculture. Aquaculture Environment Interactions, 2: 267-283.
- Green BW, Boyd CE (1995) Chemical budgets for organically fertilized fish ponds in the dry tropics. Journal of the World Aquaculture Society, 26: 284-296.
- Brown JR, Gowen R J, McLusky DS (1987) The effects of salmon farming on the benthos of a Scottish sea loch. J Exp Mar Bio Ecol, 109: 39-51.
- Monteategre R, Verde gem MCJ, Dam AAV, Verreth JA (2005) Effect of organic nitrogen and carbon mineralization on sediment organic matter accumulation in fish ponds. Aquacult Res, 36: 983-995.
- Boyd CE (1990) Water quality in ponds for Aquaculture. Alabama Agricultural Experiment Station, Auburn University, AL, USA.
- Phanna N (2011) Mass balance for water and carbon (C) in Pangasius ponds, Mekong Delta. M.Sc. dissertation, Faculty of Bioscience Engineering, Academic year 2009-2011, Universiteit Gent, pp. 37.
- Nassar MV, Morell JM Corredor JE (1994) The nitrogen budget of a tropical semi-intensive freshwater fish culture pond. J World Aquacult Soc, 25: 261-270.
- Nhan DK, Verde gem MCJ, Milstein A,Verreth JAV (2008) Water and nutrient budgets of ponds in integrated agriculture-aquaculture systems in the Mekong Delta, Vietnam. Aquacult Res, 39: 1216-1228.
- Bouwman AF, Beusen AHW, Overbeek CC, Bureau DP, Pawlowski M, Glibert PM (2013) Hindcasts and future projections of global inland and coastal nitrogen and phosphorus loads due to finfish aquaculture. Rev Fish Sci, 21 (2): 112-156.
- Flora C, Kroger R (2014) Use of vegetated drainage ditches and low-grade weirs for aquaculture effluent mitigation: I. Nutrients. Aquault Eng, 60: 56-62.