 LOGIN
LOGIN REGISTER
.png)

Research Article
Physico-Chemical Attributes and Bacterial Diversity of River Water at Deoprayag, Garhwal Himalaya, India
Swati Rawat, Chandi Prasad, Ramesh C Sharma, Sarita Bisht, Rahul Kumar*
Department of Environmental Sciences, H.N.B. Garhwal University (A Central University), Srinagar-Garhwal, Uttarakhand, India
*Corresponding Author: Rahul Kumar, Department of Environmental Sciences, H.N.B. Garhwal University (A Central University), Srinagar-Garhwal, Uttarakhand, India, E-mail: rahul.khadwalia@gmail.com
Citation: Rawat S, Sharma R C, Sarita Bisht R, Rahul K (2018) Physico-Chemical Attributes and Bacterial Diversity of River Water at Deoprayag, Garhwal Himalaya, India. J Aquat Res Mar Sci 2018: 40-46. doi: https://doi.org/10.29199/ARMS.101017
Received Date:18 July, 2018; Accepted Date: 30 August, 2018; Published Date: 05 September, 2018
Abstract
Deoprayag district is located at the confluence of River Alaknada and Bhagirathi (Both Tributaries of River Ganges) in the state of Uttrakhand. Three sites were identified S1 (Bhagirathi), S2 (Alaknanda) and S3 (Confluence) for the collection of water samples. A total of eight species of Bacteria were found in all the sampling sites. These bacterial species are Pseudomonas koreensis, Pseudomonas rhodesiae, Aeromonassal monicida, Pseudomonas montelii, Paenibacillus lactis, Microbacterium oxydans and Acinetobacter radioresistens. However, one species of bacteria was not identified. The pH was recorded between 6.53 to 7.94. Dissolved Oxygen was recorded within a range of 7.2 mg.l-1 to 9.4mg.l-1. BOD was ranged between 1.2 mg.l-1 to 2.24 mgl-1. The electrical conductivity was ranged between 87µS/cm to 121µS/cm. Salinity was recorded between 42 ppm to 68 ppm. Total Dissolved Solids was ranged between 61 ppm to 90 ppm. Free CO2 was recorded a minimum (4.4 mg.l-1) to maximum (13.2mg.l-1). Chlorides were ranged between 2.84 mg.l-1 to 7.2 mg.l-1. Total Alkalinity was observed from 167 mg.l-1 to 207 mg.l-1. Nitrate was also observed between 0.059 mg.l-1 to 1.073mg.l-1. Sulphate was ranged between 0.263mg.l-1 to 0.650 mg.l-1. Phosphates was recorded between 0.549 mg.l-1 to 0.610 mg.l-1. Hardness was recorded within 58 mg.l-1 to 72 mg.l-1. Calcium was observed between 11.22 mg.l-1 to18.84 mg.l-1. Magnesium was ranged from 5.94 mg.l-1 to 8.29 mg.l-1. The presented data will help the government officials to take care of the water quality and also force them to take some necessary steps to improve the water quality of the river.
Keywords
Bacteria; Garhwal Himalaya; Physico-chemical attributes; Deoprayag
Introduction
The freshwater bodies cover comparatively a small portion of the earth, but their value to humanity is greater than their covered area [1]. Water is literally the source of life on earth. The Garhwal Himalayan region have many lotic & lentic water bodies. Water is the major constituent of the hydrosphere that consists of oceans, seas, rivers, streams, glaciers, lakes, reservoirs, polar ice caps and shallow ground water bodies that interflow with surface water. Approximately two-third area of the earth is wrapped with the ocean water. The fluctuations in the physico-chemical characteristics of water play a crucial role in the handling, recurrence, quality as well as quantity of freshwater biota. The knowledge of physico-chemical parameters of freshwater bodies is of paramount importance as such parameters play a key role in functioning & availability of certain species.
A microorganism is defined as a living organism that is too small to see by our naked eyes. Some microorganisms like bacteria are so small that they can be visible only by an electron microscope. Microbes are the crucial organisms in the freshwater ecosystems that can act as an important factor in various ecological processes. Bacteria and fungi can play a crucial role in the conversion of biological and non-biological material through their roles in various biogeochemical cycle such as nitrogen, carbon, sulfur and phosphorus cycle thus responsible for the stability of biosphere. Thorough knowledge about the microbial diversity and their functions residing in freshwater bodies is very important and necessary for the sustainable management of freshwater resources [2].
Microorganism can be identified by culture dependent and non-culture dependent methods. Culture dependent method involves the microorganisms which are easily grown on the culture media in the artificial conditions. However, a non-culture dependent method involves the microorganisms which are not able to grow/culture on culture media in artificial condition. Deoprayag is considered as the actual origin point of holy River Ganga. As, both the rivers, Alaknanda and Bhagirathi (both tributaries of River Ganga) join each other. Due to this reason, this place is considered as a sacred place and people come here to take deep bath and drink its water [3]. They also carry its water to their homes for further worship activities. Hence, this study furnishes a stage where water quality and bacterial diversity of the Ganga River has been studied in detail as reference for further studies.
A wide range of works have been performed so far on different important aspects of the rivers that includes the works of Gupta, et al., [4], Kumar et al., [5], Raja et al., [6], Abed and Jazie [7], Joshi et al., [8], Jain et al., [9], Sharma [10] and Gupta et al. [11]. But, no sincere attempt has been made so far to assess the quality of water along with the bacterial diversity at a very important place, Deoprayag.
Materials and Methods
Study area
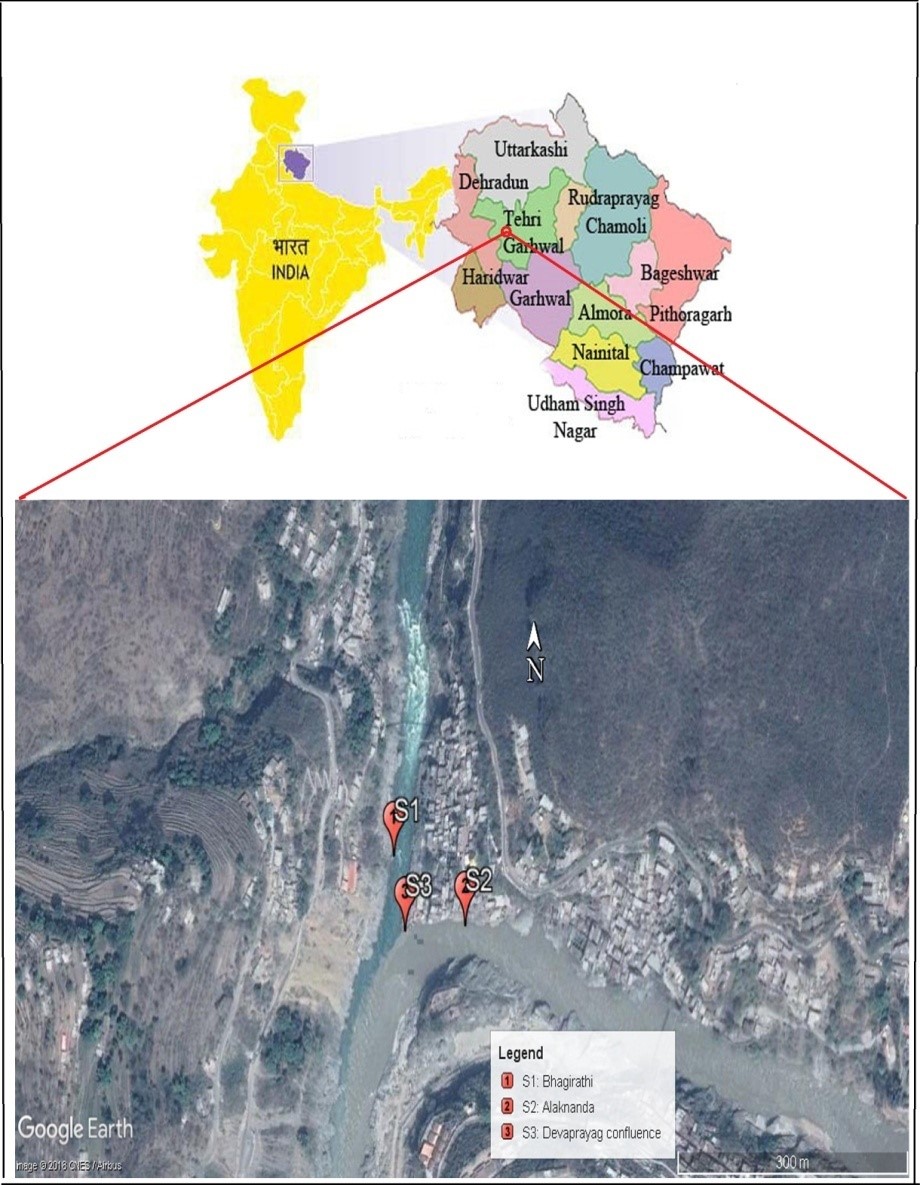
Deoprayag is famous for being a confluence of two important rivers of Garhwal Himalayas: Alaknanda and Bhagirathi. Deoprayag is significantly known as one of the five sacred confluences in the Garhwal Himalayan region. Pilgrims usually come here to take a deep bath at the meeting point of Alaknanda and Bhagirathi. It is located at an altitude of 830 m a.s.l. between the latitude 30º8’44”N and longitude 78º35’52”E in the Tehri district of Garhwal Himalaya (Figure 1). Site 1 (S1) was identified on the river Bhagirathi, which is about to 1 km earlier from the confluence at an altitude of 477 m a.s.l. between latitude 30º08’48.90”N and longitude is 78º35’56.40”E. Site 2 (S2) was identified on the river Alaknanda which is about to 1.5 km earlier from the confluence at an altitude of 484 m a.s.l. between latitude 30º08’43.54”N and longitude 78º35’58.78”E. Site 3 (S3) was identified at the confluence of both the rivers at an altitude of 463 m a.s.l. between latitude 30º08’43.69”N and longitude 78º35’52.07”E.
|
Figure 1. Google map of the study area. |
Sample collection and analysis of physico-chemical characteristics
The water samples were collected from the above-mentioned site (S1–S3) for a period of six months during December 2017 to May, 2018 by dipping the autoclaved thermo flask and closing the cap under water surface to prevent the atmospheric exposure and contamination to assess the physico-chemical parameters of the study area. The water samples were collected early morning during 08:00 am to 10:00 am. Physico-chemical characteristics of the water samples were evaluated by succeeding the standard protocol given in Wetzel and Likens [12]; APHA [13] and bacterial isolation and identification by following the standard method outlined in Harley and Prescott [14]. Some of the physico-chemical parameters such as pH, Dissolved Oxygen, free CO2, air temperature and water temperature were measured at the sampling site. For other physico-chemical characteristics, the water samples were carried to the Laboratory of Environmental Microbiology, Department of Environmental Sciences, H.N.B. Garhwal University, Srinagar-Garhwal, Uttrakhand at its earliest possible. For the microbiological sampling, the water samples were collected and stored in the sample bottles and placed them in the ice box filled with freezed ice packs and analyzed within 24 hours.
A total of seventeen physico-chemical parameters (air temperature, water temperature, Dissolved Oxygen, Biochemical Oxygen Demand, free CO2, hardness, chlorides, pH, calcium, total alkalinity, total dissolved solids, salinity, nitrates, phosphates, sulphates, magnesium and conductivity) followed by coliform test, bacterial enumeration and then identification by using the MALDI-TOF MS were assessed during the study period.
Bacterial isolation
Nutrient Agar media (HiMEDIA) was used for the isolation of bacteria from the water samples. The pH of media for bacterial isolation was set according to the pH of water at the sampling sites. Eosin Methylene Blue Agar (EMB) medium was used for the detection of the members of the family Enterobacteriaceae and culture plates were incubated at 37ºC for 48 hrs. The total number coliforms were determined by using the Most Probable Number (MPN) method. Statistical tables were used to interpret the results of Most Probable Number (MPN) of the total coliform. From each dilution 1ml was added to each of triplicate tubes containing 5 ml of MacConkey broth. The tubes were incubated at 37ºC for 48 hrs for total coliforms. The positive tubes were streaked on the Eosin Methylene Blue (EMB) agar plates and incubated at 37ºC for 48 hrs [14].
Bacterial identification
To observe the morphological characteristics, the bacterial isolates were Gram stained and observed under Phase Contrast Microscope (Nikon Eclipse TS100). Moreover, detailed biochemical characterization was carried out to identify the bacterial isolates up to possible genus or species level. All the bacterial cultures isolated from the water samples of the study area were sent to National Centre for Microbial Resources, National Centre for Cell Sciences, Pune for further identification by using the MALDI-TOF MS. Statistical treatment (mean; standard deviation) of the physico-chemical parameters of water was carried out for presenting the mean seasonal variations of the river water.
Results and Discussion
Physico-chemical characteristics
The Water samples from three different sites, Bhagirathi (S1), Alaknanda (S2) and Confluence (S3) of both rivers were assessed for a period of six months during December 2017 to May 2018. A total of seventeen physico-chemical parameters were recorded are Air temperature, Water temperature, pH, Dissolved Oxygen, BOD, Free CO2, Total Dissolved solid (TDS), Total alkalinity, Calcium. Magnesium, Conductivity, Sulphate, Nitrate, Phosphate, Chloride, Salinity and Total Hardness were recorded. The recorded data of physico-chemical environmental variables (minimum, maximum, mean and S.D.) are presented in table 1.
Table 1: Statistical Mean and standard deviation of physico-chemical parameters |
||||||||||||||||||||||||||||||||||||||||||||||||||||||||||||||||||||||||||||||||||||||||||||||||||||||||||||||||||||||||||||||||||||||||||||||||||||||||||||||||||||||||||||||||||||||||||||||
A variation in the air temperature was recorded within a range of minimum (17 ºC) at site S1 to maximum (28 ºC) at site S2 and S3. The water temperature was recorded within a range of minimum (11.8 ºC) at site S3 to maximum (18.7 ºC) at site S2. Kansal et al., [15] was recorded same range of water temperature (17.47 to 19.33 ºC) for Himalayan Rivers in India. Tiwari et al., [16] was also recorded similar range of temperature (17 to 28 ºC) for the Ganga River, India. The pH of the water samples were recorded between minimum (6.53) at site S1 to maximum (7.94) at site S2. This high pH may be due to the high amount of pollution and waste dissolved in the water. Similar range was reported by Sharma and Walia [17] for Satluj River (Himachal Pradesh, India).
Dissolved Oxygen was recorded within a range of minimum (7.2 mg.l-1) at site S2 to maximum (9.4 mg.l-1) at site S3. Comparative findings were recorded by Kamal et al., [18] for water samples of Mouri River, Kulna, Bangladesh and Sen et al., [19] observed a minimum level of D.O. in pond and river water due to water pollution. A variation was observed in Biochemical Oxygen Demand. It was ranged between minimum (1.2 mg.l-1) at site S2 and maximum (2.2 mg.l-1) at site S3. Matta et al., [20] was reported 0.90-2.39 mg.l-1 during 2013-2014 for Ganga Canal System in Himalayan Region. However, the electrical conductivity was recorded within a range of minimum (87µS/cm) at site S1 to (121 µS/cm) at site S2. Similar results were observed by Ezeribe et al., [21].
Salinity was observed within a range of minimum (42ppm) at site S1 to maximum (68ppm) at site S2. A variation was observed in the concentration of total dissolved solids. It was ranged between minimum (61ppm) at site S2 and maximum (90ppm) at site S2 and S3. These results were supported by the finding of Pathak et al., [22], Dwivedi and Nautiyal [23]. The concentration of free CO2 was recorded within a range of minimum (4.4 mg.l-1) at site S1 to maximum (13.2 mg.l-1) at site S2 and S3. Similar types of results were recorded by Sahni and Yadav [24].
The concentration of chloride was ranged between minimum (2.84 mg.l-1) at all the sampling sites and maximum (7.2 mg.l-1) at site S2 and S3. Low chloride concentration was observed in the month of December by Sahni and Yadav [24] in Bharawas pond in Haryana; Shiddamallaya and Pratima [25] in fresh water body. Chlorides higher concentration is considered as an indicator for higher organic waste pollution of animal origin. Venkatesharaju et al. [26] recorded the higher concentration of chloride in the month of May. It may be due to the raised temperature. Total Alkalinity was recorded within a range of minimum (167 mg.l-1) at site S1 to maximum (207 mg.l-1) at site S2. Similar concentration was also recorded by Sen et al. [19] in the water of river in Assam.
The concentration of nitrates was recorded within a range of minimum (0.059mg.l-1) at site S1 to maximum (0.75mg.l-1) at site S3. Tiwari et al., [16] was reported the nitrates from 2.1 to 2.2 mg.l-1 for Ganga River water at Varanasi. Sulphate was ranged between minimum (0. 263mg.l-1) at site S1 to maximum (0.65mg.l-1) at site S3. Similar results were observed by Chavan et al., [27]. However, phosphate was recorded within a range of minimum (0.549mg.l-1) at site S1 to maximum (0.61mg.l-1) at site S2 and S3. Tiwari et al., [16] was reported the phosphate range between 0.82 to 1.58 mg.l-1 for Ganga River water at Kanpur.
Hardness was recorded within a range of minimum (58 mg.l-1) at site S1 to maximum (72 mg.l-1) at site S1 and S3. Hardness of water is due to major cations and Magnesium ions in the river. Calcium was ranged between minimum (11.22mg.l-1) at site S1 and S3 and maximum (18.84mg.l-1) at site S3. Similar range of calcium was reported by Sharma and Walia [17] from Sutlaj River. A variation was observed in the concentration of magnesium. It was recorded within a range of minimum (5.94 mg.l-1) at site S1 to maximum (8.29mg.l-1) at site S2 and S3.
Bacterial Diversity
Microorganisms have great tolerance for pH, temperature, pressure, salinity and water availability, Thus, environmental factors greatly influence the survival of microorganisms. A total of eight bacterial species were found and identified in all the three sampling (S1, S2, S3). The species are Pseudomonas koreensis, Pseudomonas rhodesiae, Aeromonassal monicida, Pseudomonas montelii, Paenibacillus lactis, Microbacterium oxydans and Acinetobacter radioresistens. However, one species of bacteria was not identified. The list of identified bacteria is given in Table 2 along with the morphological and biochemical test results in Table 3.
Table 2: Bacterial Diversity of Bhagirathi, Alaknanda and Confluence at Deoprayag. |
Abbreviations: +: positive; -: negative; v: variable. |
Coliform Density
During the sampling period of December 2017, the MPN value of total coliform per 100 ml was recorded to be 28 for site S1; 28 for site S2 and 21 for site S3. However, for the month of May 2018 it was recorded to be 1100 for site S1; 460 for site S2 and 210 for site S3 (Table 4).
|
December 2017
May 2018
Table 4: MPN values per 100ml of sample and 95% confidence limits for various combinations of positive and negative results (when three 10-ml, three 1-ml, and three 0.1-ml test portions were used). |
|||||||||||||||||||||||||||||||||||||||||||||||||||||||||||||||||||||||||||||||||||||||||||||||||||||||||
Conclusion
A variation was observed in the water temperature of river between 11.8ºC to 18.7ºC. pH was recorded within a range between 6.53 to 7.94. DO was ranged between 7. 2mg.l-1 to 9.4mg.l-1. BOD was recorded within a range between 1.2 mg.l-1 to 2.2 mg.l-1. Electrical Conductivity was recorded from 87µS/cm to 121 µS/cm. TDS was recorded between 61ppm and 90ppm. Free CO2 was ranged between 4.4 mg. l-1 to 13.2 mg.l-1. Chloride was ranged between 2.84 mg.l-1 to 7.2 mg.l-1 during study period. Total Alkalinity was recorded between 167 mg.l-1 to 207 mg.l-1. Nitrate was ranged between 0.059mg.l-1 to 0.75mg.l-1. However, the concentration of phosphate was recorded between 0.549mg.l-1 to 0.61mg.l-1. Total Hardness was recorded between 58 mg.l-1 to 72 mg.l-1 and the concentration of calcium was ranged between 11.22mg.l-1 and 18.84mg.l-1. The α-diversity of bacteria at the study area is eight i.e. Pseudomonas koreensis, Pseudomonas rhodesiae, Aeromonassal monicida, Pseudomonas montelii, Paenibacillus lactis, Microbacterium oxydans and Acinetobacter radioresistens. The various physico-chemical parameters of surface water of the river revealed that the water quality is “poor” and is not fit for human consumption. However, the presence of high amount of total coliform also confirmed the poor quality of the water during the study period. It requires regular monitoring of physico-chemical properties and bacterial diversity. This maiden study on the assessment of water quality of the sacred river Ganga can be a baseline data for taking remedial measures and developing a plan for its conservation and management for sustainable use of water resources by the tourists, pilgrims, wild life and local inhabitants.
Acknowledgements
One of the authors (Rahul Kumar) thankfully acknowledges the fellowship given by the University Grant Commission, New Delhi through Hemvati Nandan Bahuguna Garhwal University (A Central University), Srinagar-Garhwal, Uttarakhand, India, for undertaking the present work.
Conflict of Interest
The authors declare that there is no conflict of interest
References
- Odum EP (1996) Fundamental of Ecology. WB Sanders Company, Philodelphia and London:1-574.
- Hahn M W (2006). The microbial diversity of inland waters. Current opinion in biotechnology 17(3), 256-261.
- Pandey P, Kang SC, Maheshwari DK (2005) Potential Microorganisms for Sustainable Agriculture: A Techno-Commercial. Current Science 89: 177–180.
- Gupta N, Panday P, Hussain J (2017) Effects of physiochemical biological parameter on the quality of river water of Narmada, M P, India. Water Science 31: 11-23.
- Kumar V, Arya S, Dhaka A, Minakshi, Chanchal (2011) Physiochemical characteristics of Yamuna River around Hamirpur, Bundelkhand region Central India. Int Multidis Res J 1:14-16.
- Raja P, Amarnath AM, Elangovan R, Palanivel M (2008) Evaluation of physical and chemical parameters of river Kaveri, Tiruchirappalli, Tamil Nadu, India. J Environ Biol 29, 765-768.
- Abed S A, Jazie A A (2014) Assessment of Some Physico-Chemical Properties For Water In Ganga River At Varanasi, India. Al-Qadisiya Journal for Engineering Sciences 7: 148-164.
- Joshi D M, Kumar A, Agrawal N (2009) Studies on physicochemical parameters to assess the water quality of river Ganga for drinking purpose in Haridwar district. Rasayan journal of chemistry 2: 195-203.
- Jain C K, Malik D S, Tomar G (2018) Seasonal variation in physico-chemical and phytoplankton diversity of Alaknanda River at Garhwal region (Uttarakhand). INT J of Fish and Aquat Studies 6: 353-357.
- Sharma S (2015) Microbial diversity of Indian Himalayan Region. ENVIS Newsletter on Himalayan Ecology 12: 6.
- Gupta P, Asthana M, Kumar A, Barun, S (2014) Physicochemical analysis and microbial diversity of Yamuna water and industrial effluents. International Journal of Applied Sciences and Biotechnology 2: 199-205.
- Wetzel RG, Likens GE (1991) Limnological Analysis, 2nd Edn. Springer-Verlag, New York. Inc: 1-391
- APHA (2005) Standard methods for the estimation of water and waste water, 21thedn. American Waste Water Association and Water Pollution Control Federation, Washington.
- Bisht S, Sharma R C, Rawat S (2018) Physico–chemical attributes and bacterial diversity of river water at Rudraprayag, Garhwal Himalaya. MOJ Eco Environ Sci 3: 277-282.
- Kansal A, Nihal A, Siddiqui and Gautam A (2011) Deterioration of Water Quality of Some Eco-efficient Himalayan Rivers in India. International Journal for Environmental Rehabilitation and Conservation 1: 29-49.
- Tiwari A, Dwivedi A C, Mayank P (2016) Time scale changes in the water quality of the Ganga River, India and estimation of suitability for exotic and hardy fishes. Hydrology Current Research 7: 254.
- Sharma N, Walia Y K (2018) Water Quality Investigation by Physicochemical Parameters of Satluj River (Himachal Pradesh, India). Current World Environment 12.
- Kamal D, Khan A N, Rahman M A, Ahamed F (2007) Study on the physico chemical properties of water of Mouri River, Khulna, Bangladesh. Pakistan Journal of Biological Sciences 10: 710-717.
- Sen S, Paul M K, Borah M. (2011) Study of some physico-chemical parameters of pond and river water with reference to correlation study. Int J Chem Tech Res 3: 1802-1807.
- Matta G, Kumar A, Srivastava S, Singh V, Dhingra G.K (2015) Impact assessment on water quality of Ganga Canal System in Himalayan Region. International Journal of Scientific & Engineering Research 6: 1524-1531.
- Ezeribe A I, Oshieke K C, Jauro A (2012) Physico-chemical properties of well water samples from some villages in Nigeria with cases of stained and mottle teeth. Science World Journal 7: 1-3.
- Pathak R K, Gopesh A, Dwivedi A C (2015) Invasion potential and biology of Cyprinus carpio (Common carp) LAP LAMBERT Academic Publishing GmbH & Co. KG, Dudweiler Landstr 99: 66123 .
- Dwivedi A C, Nautiyal P (2013) Alien fish species, Cyprinus carpio (common carp) as a invader in the Vindhyan region (Ken, Paisuni, Tons rivers), India. J Kalash Sci 1: 133-139.
- Sahni K, Yadav S (2012) Seasonal variations in physico-chemical parameters of Bharawas Pond, Rewari, Haryana. Asian J Exp Sci 26: 61-64.
- Shiddamallayya N, Pratima M (2008) Impact of domestic sewage on fresh water body. Journal of environmental biology 29: 303.
- Venkatesharaju K, Somashekar R K, Prakash K L (2010) Study of seasonal and spatial variation in surface water quality of Cauvery river stretch in Karnataka. Journal of ecology and the natural environment 2: 001-009.
- Chavan AW, Dhamani A A, Murkute VB (2006) Seasonal variation in the physicochemical parameter of river Wainanga near Bramhapuri, Dist. Chandrapur Vidh Inter Interd Res J 1: 28-35.